Developing strategies. Designing experiences.
Chances are, if you’re running a marketing campaign, you’re going to want to measure the success of your efforts, not only to report to your clients, but also to help you make future marketing decisions.
And the more detailed your campaign reporting is, the more helpful it will be to guide your decision-making process and improve your future efforts.
By utilizing the parameters from the UTM tracking links you (hopefully) created at the start of your campaign, you can attribute interactions and conversions to the exact ad, email, etc. that users clicked to visit your website.
Follow this step-by-step guide to learn how to find UTM parameter data in Google Analytics 4 (GA4) to attribute conversion data to specific campaigns, individual ads, and more.
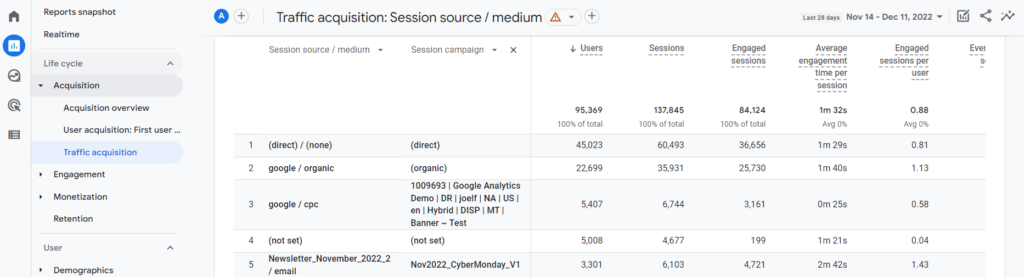
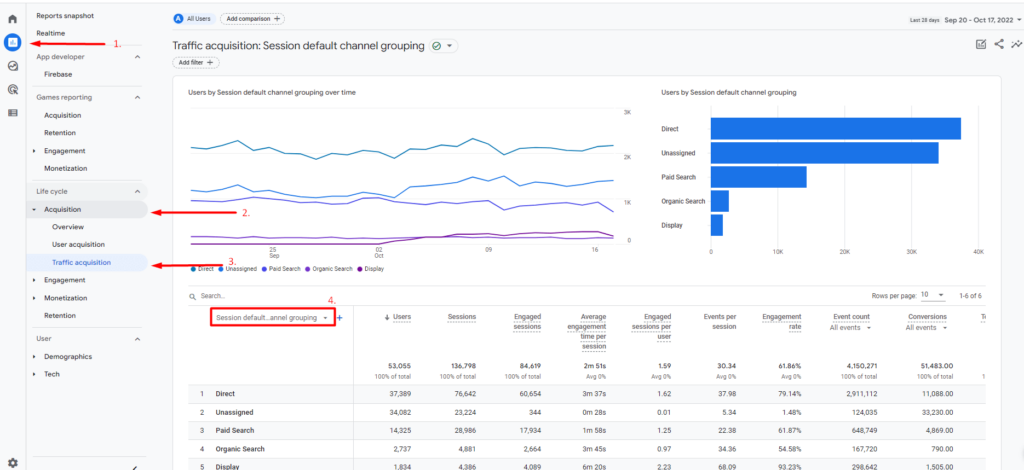
Start by heading to the Traffic acquisition report.
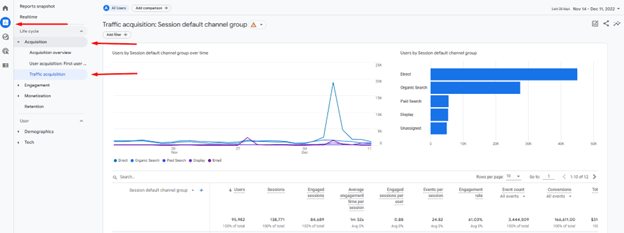
In the left-hand navigation panel, click Reports, then the Acquisition drop-down, then Traffic acquisition.
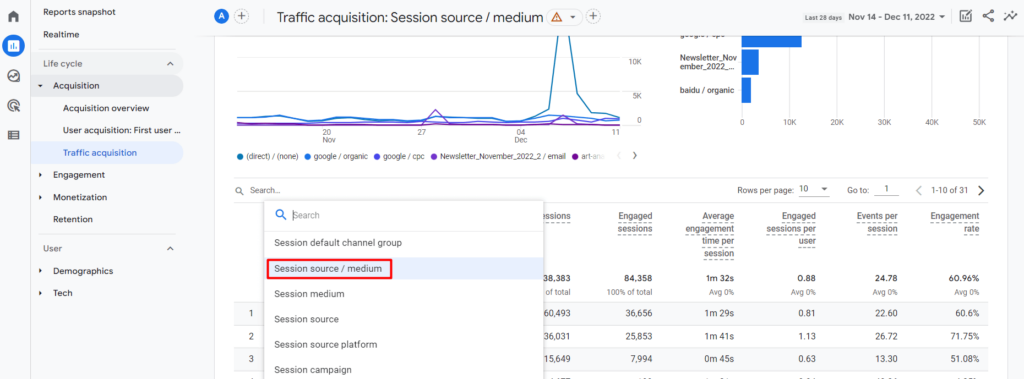
This report has Session default channel group as the default dimension. Let’s change it to Session source / medium using the drop-down.
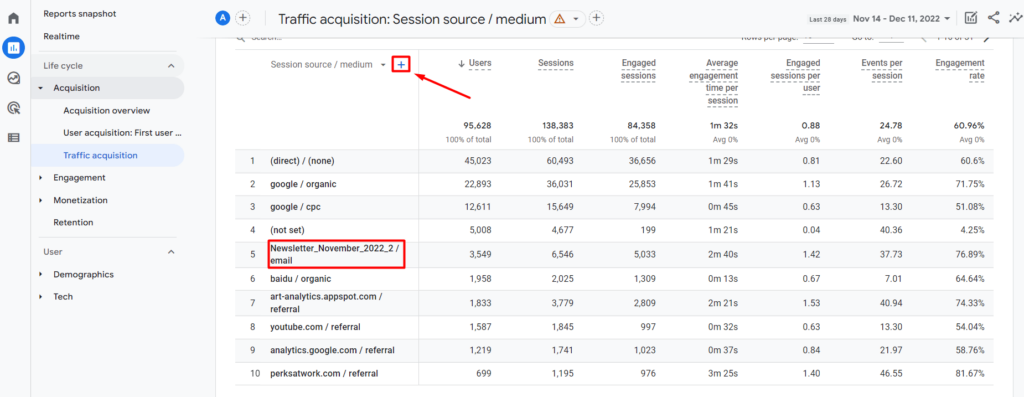
Now we can see data organized by the source and the medium they used to arrive at your website. For example, in the chart above, you can see data from an email campaign.
If you want to dive deeper and see, for example, data from a specific email or even a specific link in your email, we’ll need to add a second dimension. Click on the blue plus next to your main dimension.
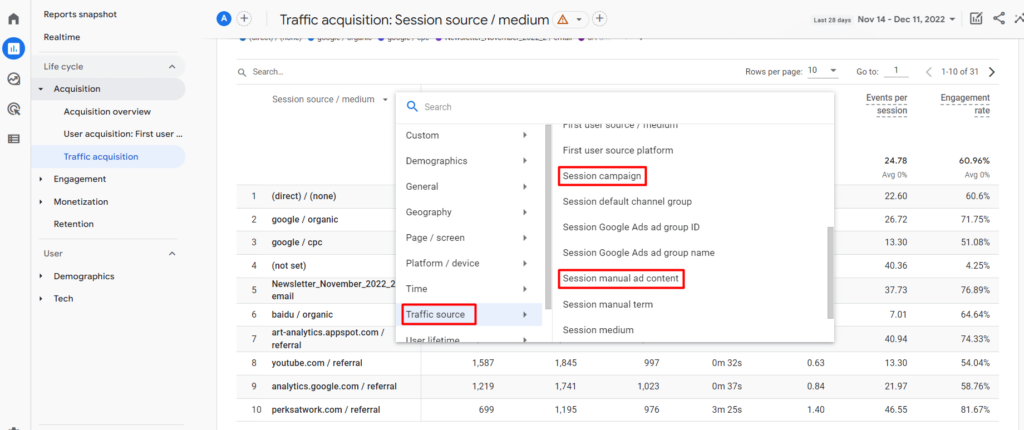
Select Traffic source then choose either Session campaign or Session manual ad content.
Session campaign will show you what you chose for your campaign name parameter. Session manual ad content will show you what you chose for your campaign content. Below is example data for each dimension.
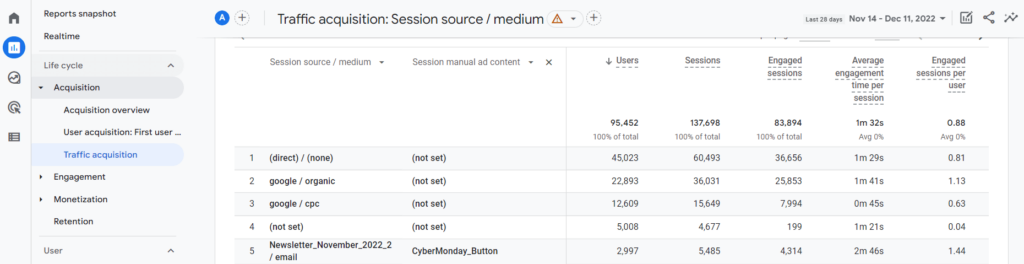
You can also use Session manual term if you utilized the campaign term parameter in your tracking link.
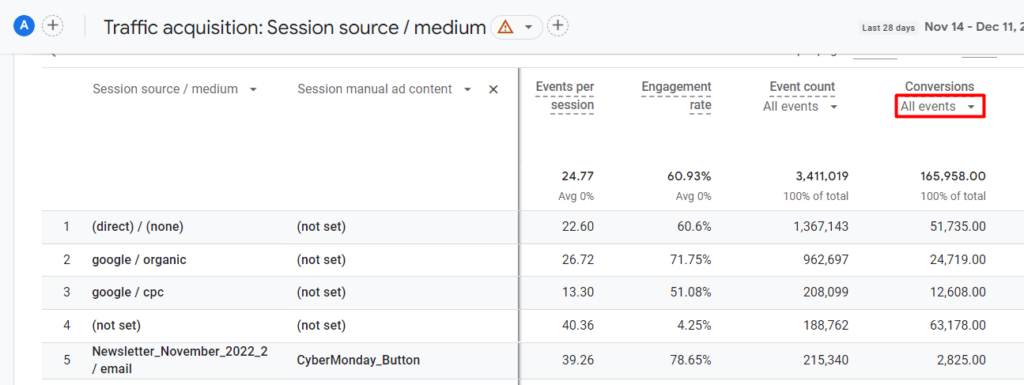
All you need to do is scroll over this chart to see conversion data from your individual marketing efforts. Use the drop-down under Conversions to view data from specific conversions.
Now you can use this detailed data to help you tweak your campaigns, improve your strategy, and meet your goals.
Ready to Learn More About GA4 Conversion Tracking?
Check out our other Google Analytics 4 step-by-step guides in our blog: How to Find Basic Data from UA in GA4.
Or contact us today to learn more about our GA4 training sessions so you can find and report on conversions, website data, and more with ease.
In Universal Analytics, you can find the browser and operating system (OS) your visitors used to access your website by navigating to reports, clicking the audience category drop-down, then expanding the technology reports section. Here you will find the Browser & OS report.
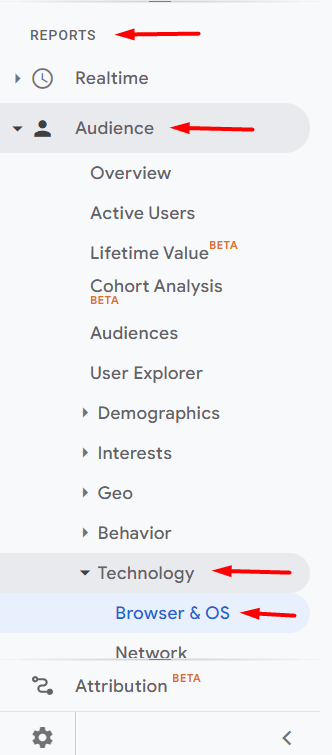
This report is useful when you’re thinking about making changes to your site that may work differently in various browsers, operating systems, and screen sizes. Follow this step-by-step guide to find the browser and OS report in Google Analytics 4 (GA4).
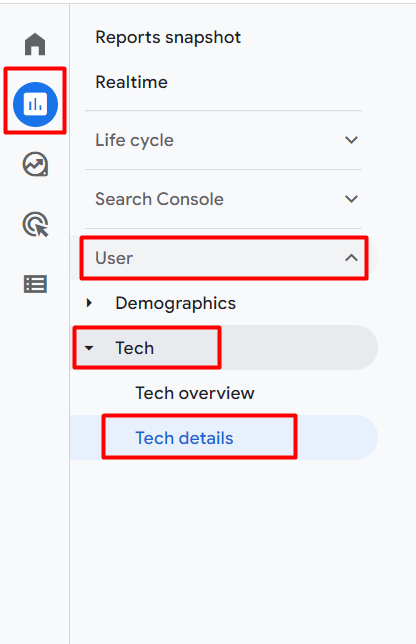
To find the browser and OS report in GA4, we’ll first need to navigate to the user reports section.
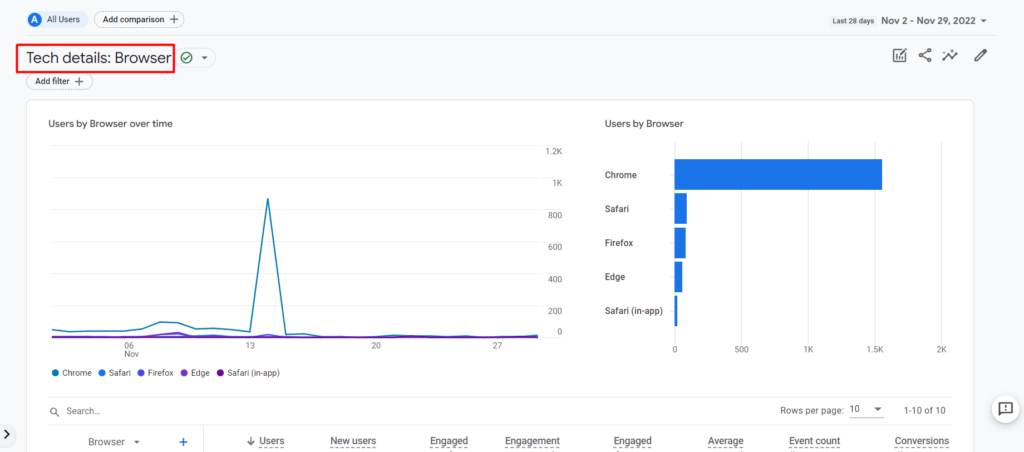
This report defaults to showing us the browser data.
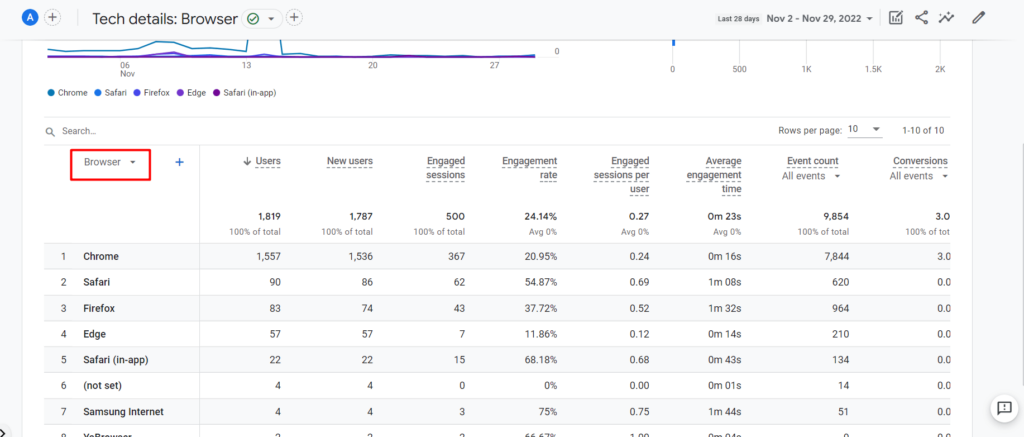
To change this dimension, scroll down to the table and use the dropdown to select another dimension to view. Here we can click on Operating systems.
If you would like to view both the browser and the OS data, you can click the plus sign to add Operating system as a Secondary Dimension.
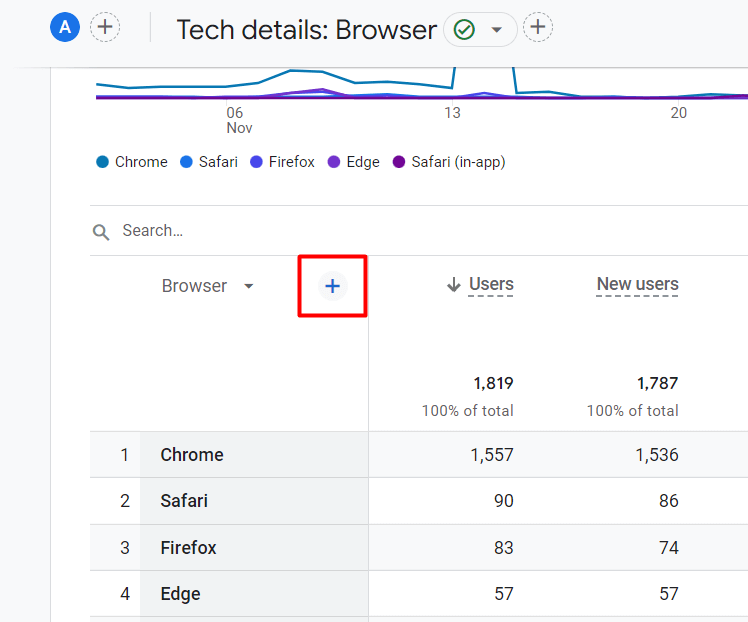
Now you can view both the most popular browser and the operating systems your users utilize.
Want to learn how to easily find other reports in GA4? Check out our other step-by-step guides in our blog: How to Find Basic Data from UA in GA4.
Or contact us today to learn more about our one-on-one GA4 training sessions so you can navigate GA4 like a pro. Contact us today for more information.
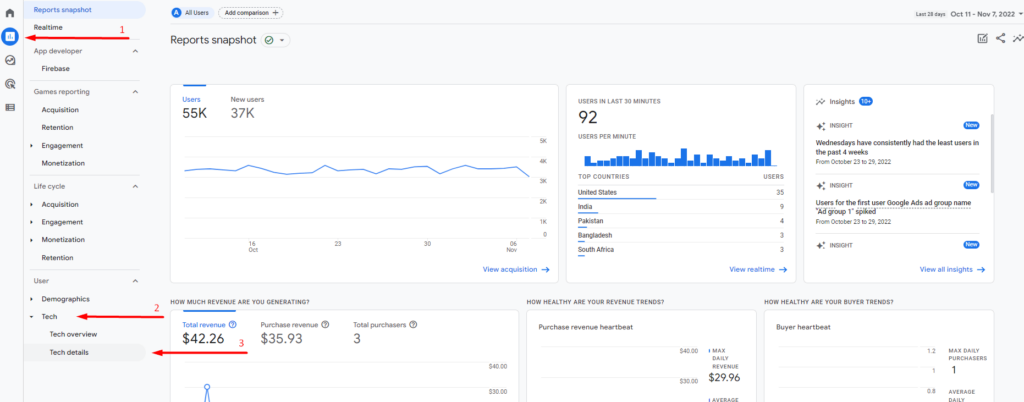
Universal Analytics (UA) offered reports that allowed you to view and sort user behavior and acquisition data by device category (desktop, mobile, or tablet), devices (phone brand and version), and browser. Luckily, Google Analytics 4 (GA4) offers the same data in the Tech report.
Follow this step-by-step guide to find the Tech report in GA4.
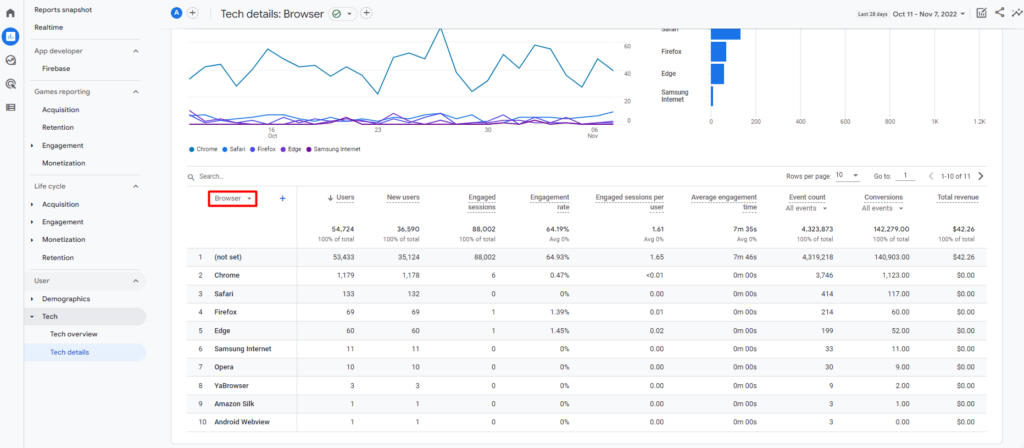
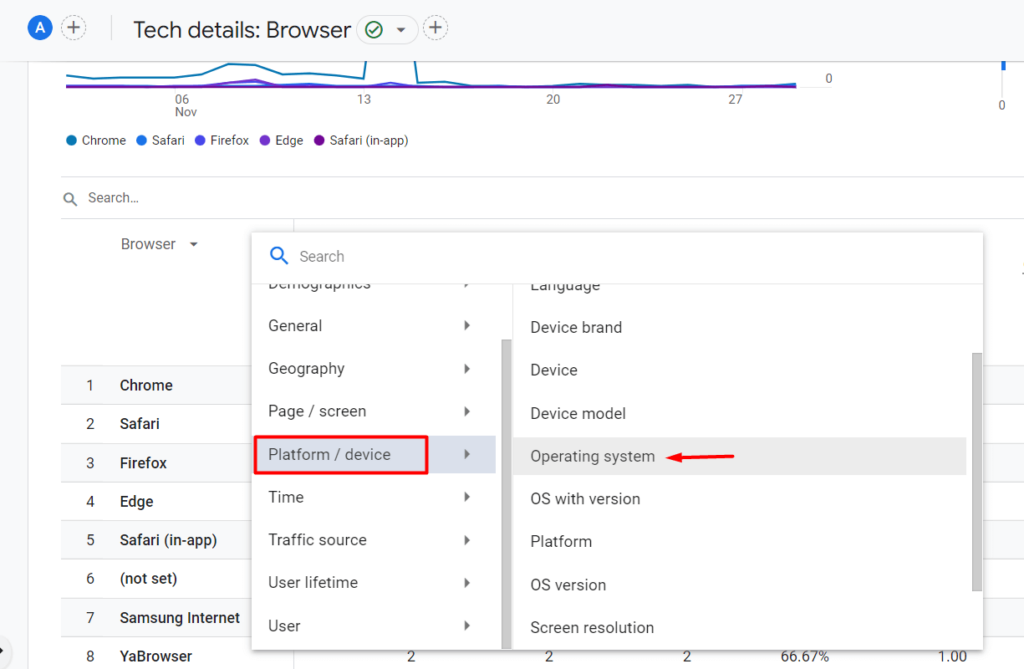
Once in the Tech details report, you’ll notice that the default dimension is Browser. You can click the arrow to switch between dimensions.
The dimension options in the Tech details report include:
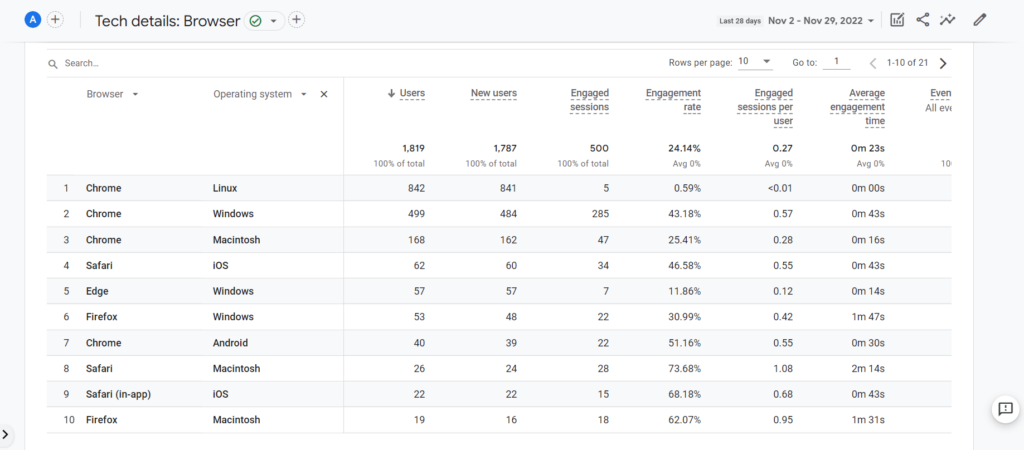
Now you know how to find device information, browser data, and more in the GA4 Tech details report! You can use this data to understand the types of technology your audience is using to access and interact with your content. That way, you can enhance your current content as well as plan for future content. You can also make sure that your website is functioning in all the browsers your audience is using.
Looking for more GA4 how-to guides? Learn how to find other important reports in our blog: How to Find Basic Data from UA in GA4.
We also offer training so you can navigate GA4 and analyze your data like a pro. Contact us today for more information.
In Universal Analytics, you can use the conversions reports to track valuable actions users take on your website, such as submitting a contact form or clicking on the phone number to call. If you have goal conversions set up in your Universal Analytics property view, you can view the goals report by going to Conversions, then Goals, then Overview.
In Google Analytics 4 (GA4), goals are referred to as conversions. Just like in Universal Analytics, conversions require setup and configuration. Once you have your conversions set up, follow this step-by-step guide to view the conversions report.
Remember, you have to set up and configure events and conversions before you can view data in the conversions report. But don’t worry, we’re here to help set up and configure your new GA 4 property, contact us to learn more.
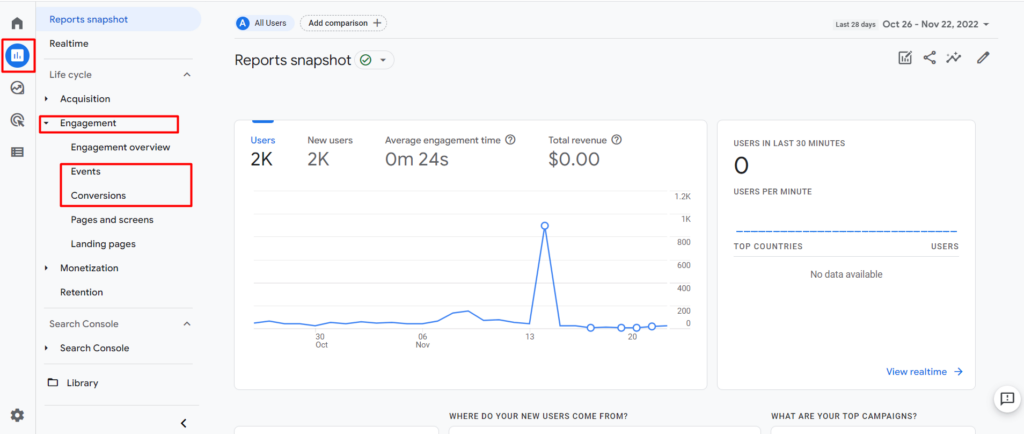
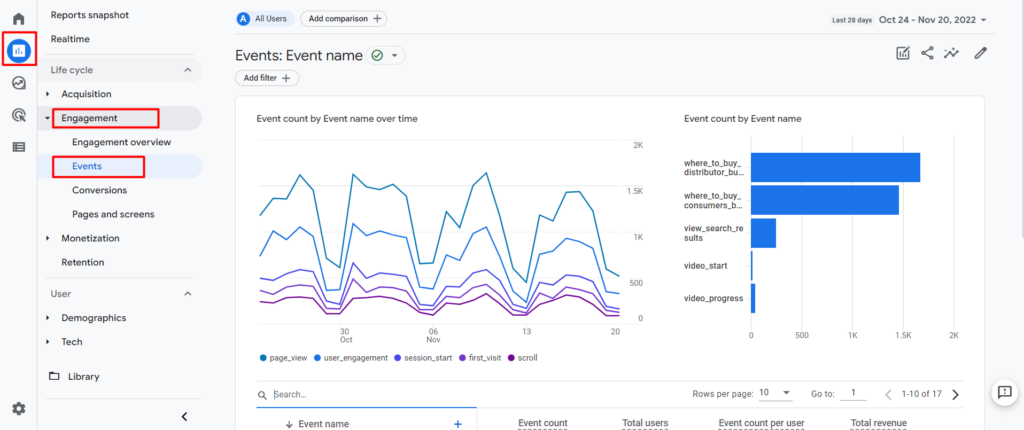
After you configure your events and conversions, click on Reports and Engagement. Here you will find the Events report and the Conversions report.
In the Events report, you can view a complete list of all the recorded events in your GA4 property. You can see how many times each event was triggered in the Event count column. And how many users triggered each event in the Total users column.
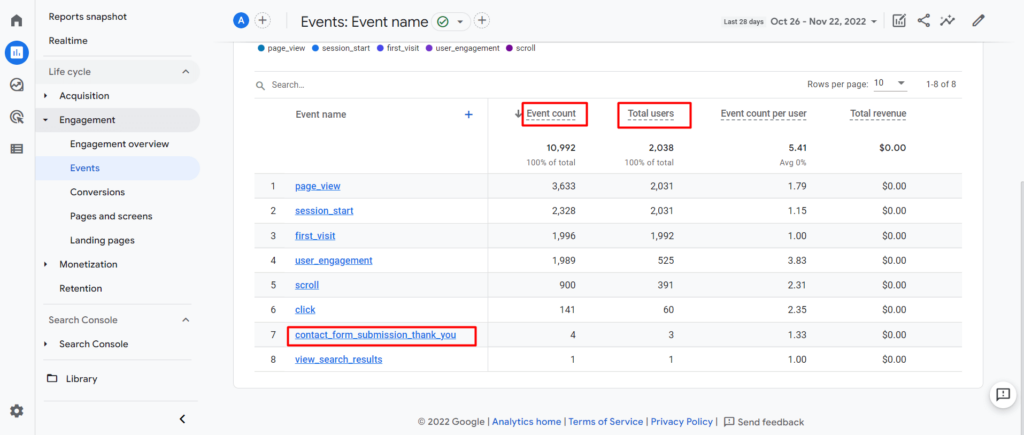
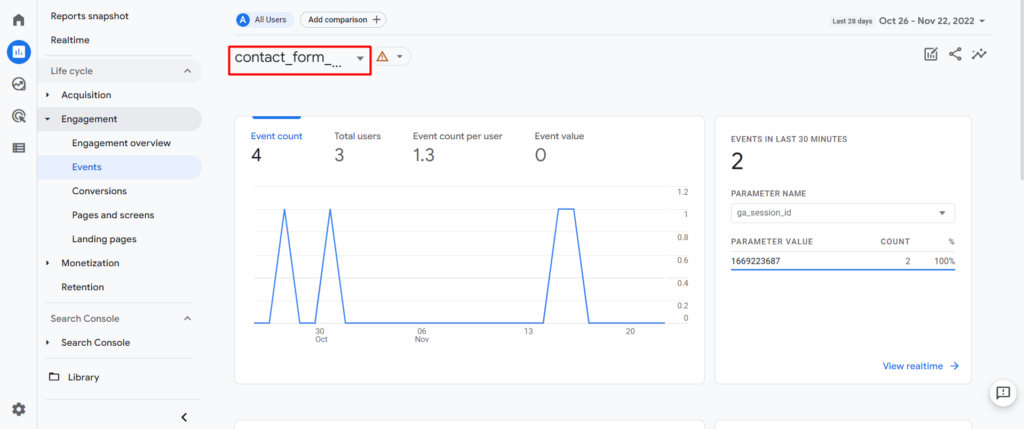
If you want to see a detailed report on a specific event, you can just click the Event name in the data table.
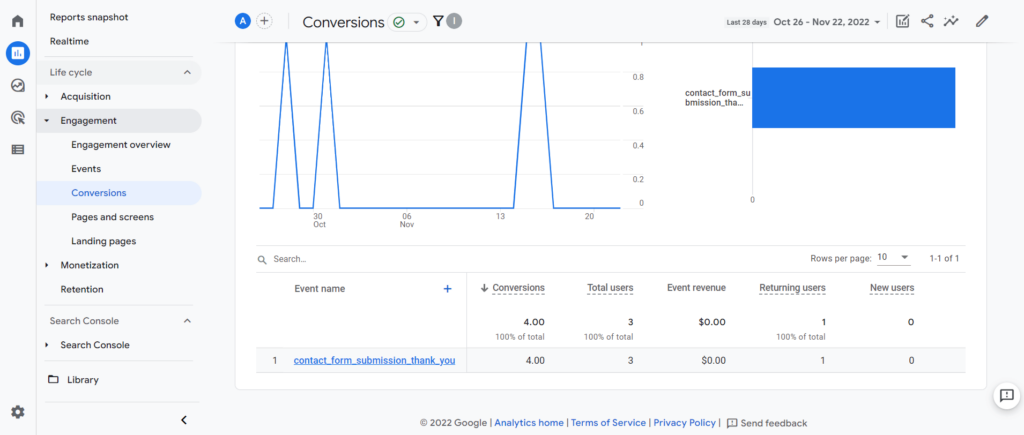
In the Conversions report, you can view the data for specific events you flagged as conversion points for your website. This GA4 report is the equivalent of the goals report in Universal Analytics.
Check out our other Google Analytics 4 step-by-step guides in our blog: How to Find Basic Data from UA in GA4.
Or contact us today to learn more about our in-depth, 1-on-1 GA4 training sessions so you can navigate GA4 like a pro.
In Universal Analytics (UA), the site search report showed:
However, to view this report in UA, you had to first enable its functionality.
Just like UA, Google Analytics 4 (GA4) requires you to enable certain settings before you can view the GA4 site search report. Follow this step-by-step guide to enable and view your Google Analytics site search report.
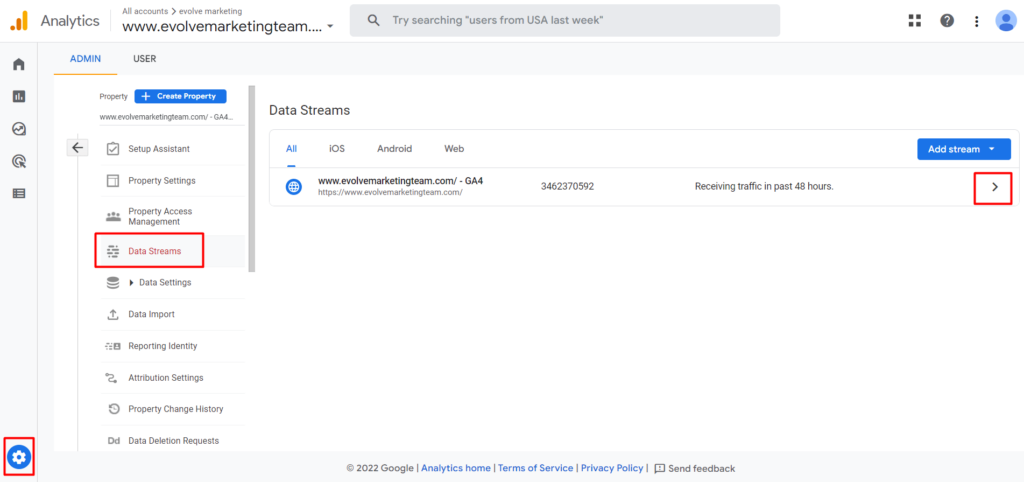
To enable the site search tracking functionality in GA4, navigate to your GA4 property and go to Admin. In the Admin settings, click on Data Streams and select your web stream.
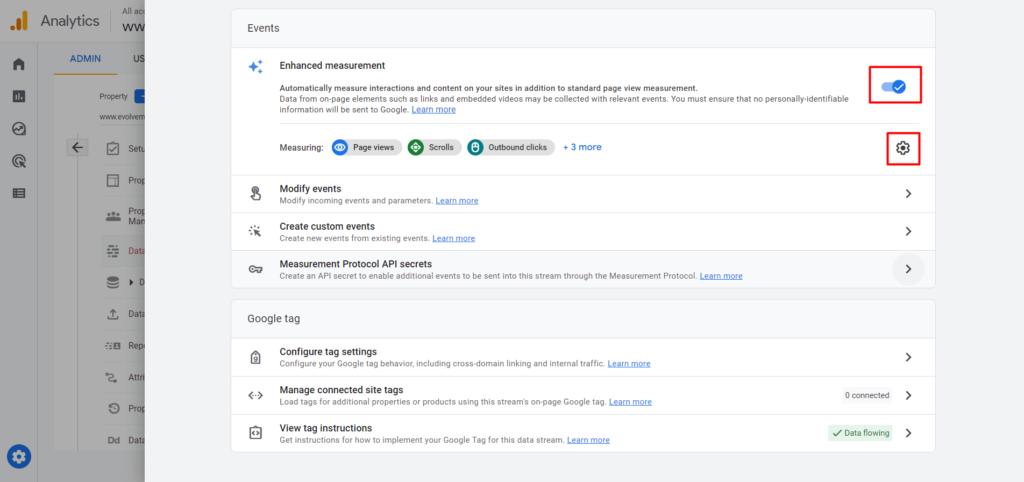
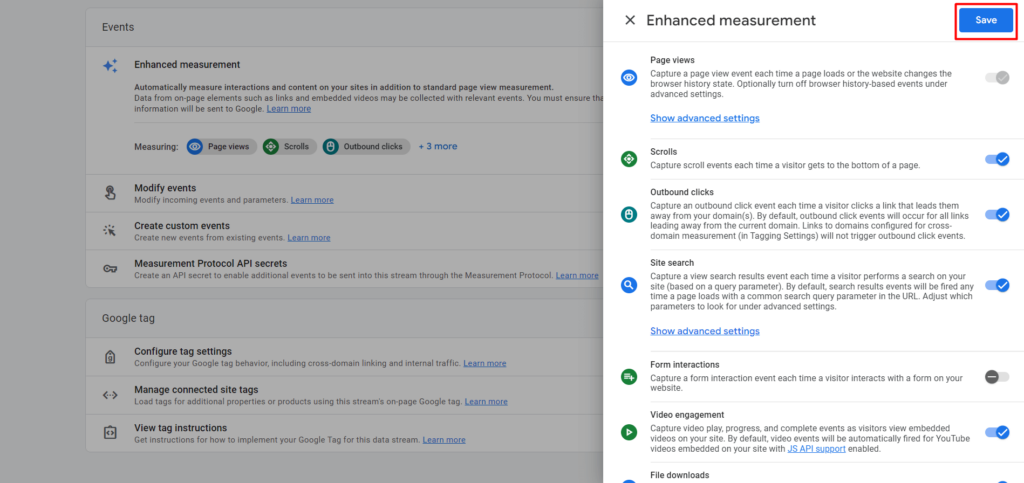
Here, you can make sure that Enhanced measurement is enabled. Once enabled, click on the gear icon to edit the enhanced measurement settings.
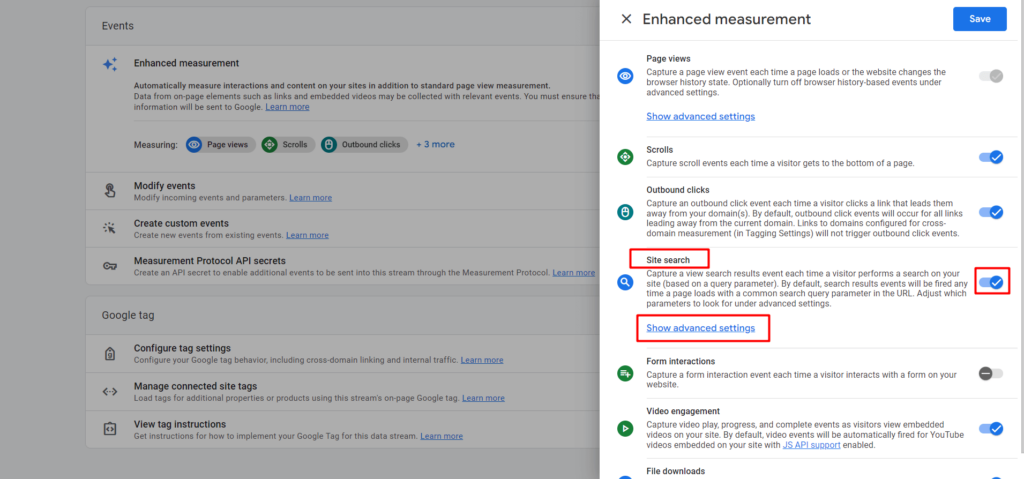
In the enhanced measurement settings, scroll down to ensure Site search is enabled. Once enabled, click on Show advanced settings.
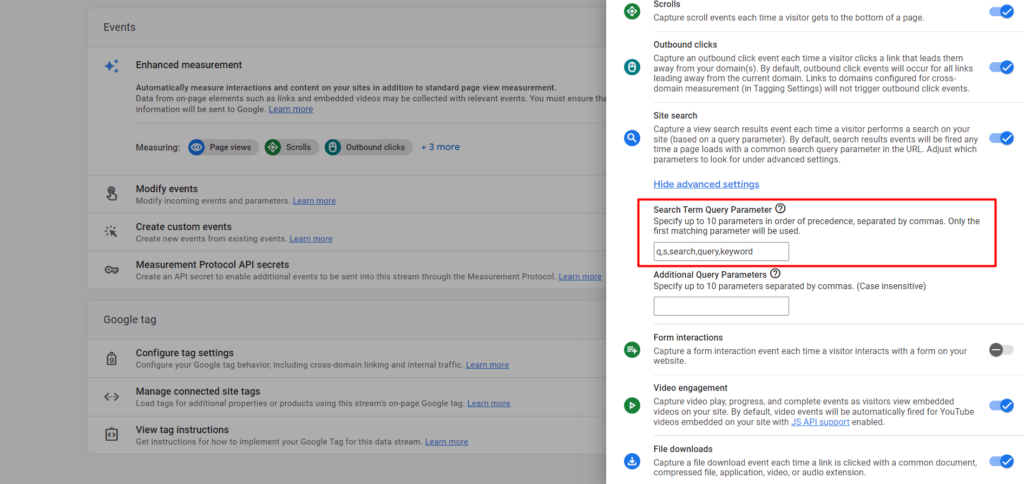
Here, you will see five default query parameters that GA4 recognizes: q, s, keyword, search, and query. If your website uses a different query parameter in the URL to store the search keyword, enter that parameter. You can have up to 10 parameters total (separated by a comma).
Finally, be sure to save your settings. You now have enabled the site search tracking functionality in GA4. However, we’re not done setting up all the required settings in GA4 to see the site search report yet.
Please Note: If you do not complete the following steps, you will only be able to view site search terms in your real-time report for the past 30 minutes.
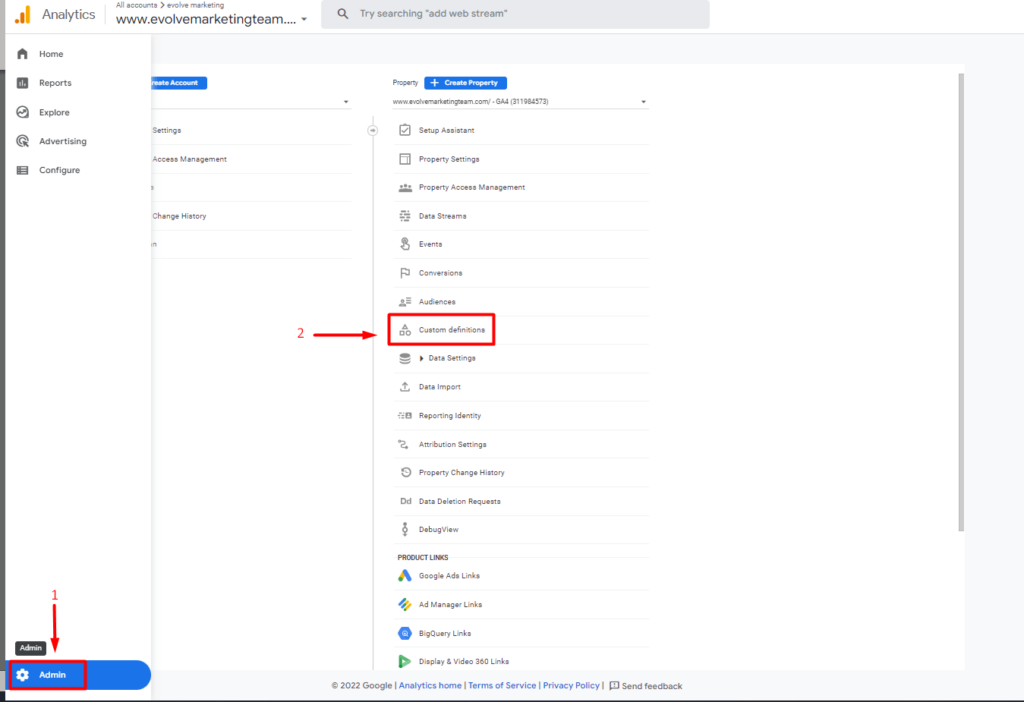
Once you enable and save the site search functionality, you’ll need to configure a Custom definition in the Admin panel.
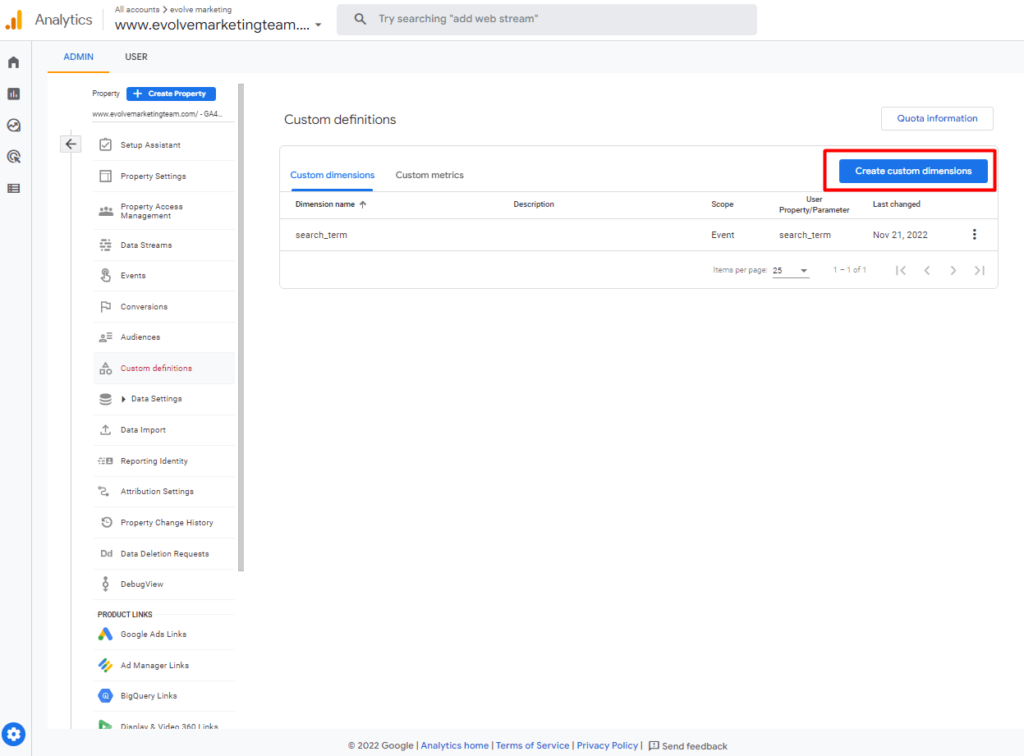
Here, we will create a new Custom dimension.
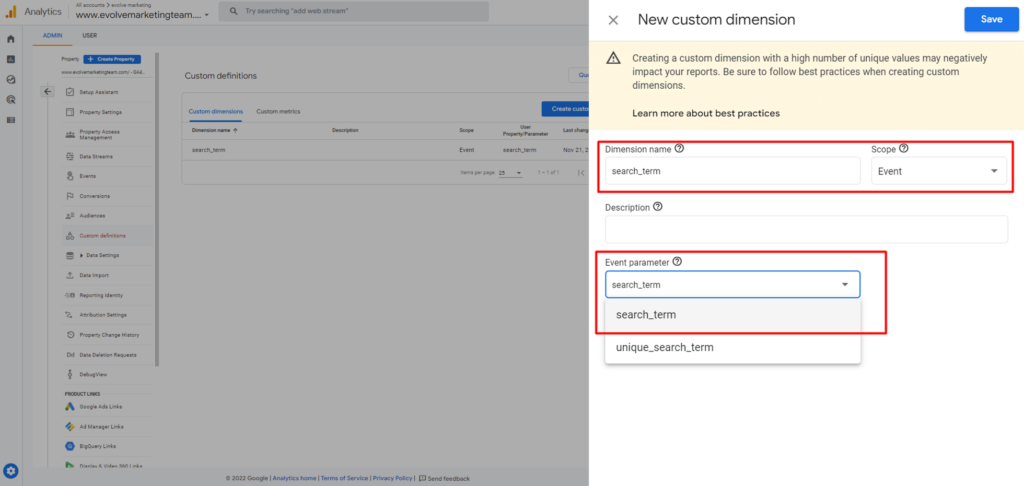
Enter search_term as the dimension name. Leave the scope set as event. Then, select search_term in the event parameter drop-down menu and save.
Congratulations, you are now tracking site search data!
Once you have set up site search tracking, you must wait at least 24 hours before you can find site search terms data in your GA4 property. Continue reading to find out how to navigate to the site search report.
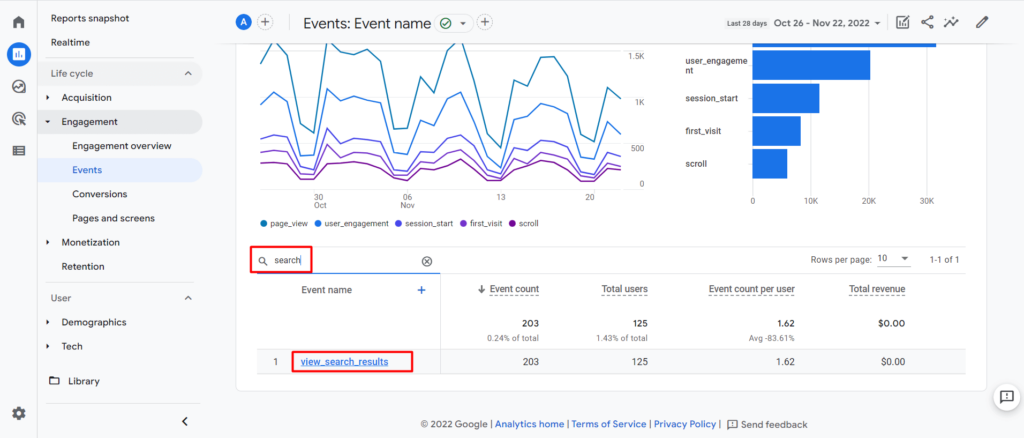
Once 24 hours have passed and site search data has begun to collect, navigate to your GA4 property, and then Reports. Go to Engagement and view the Events report.
In the search box, type in search, then click on view_search_results.
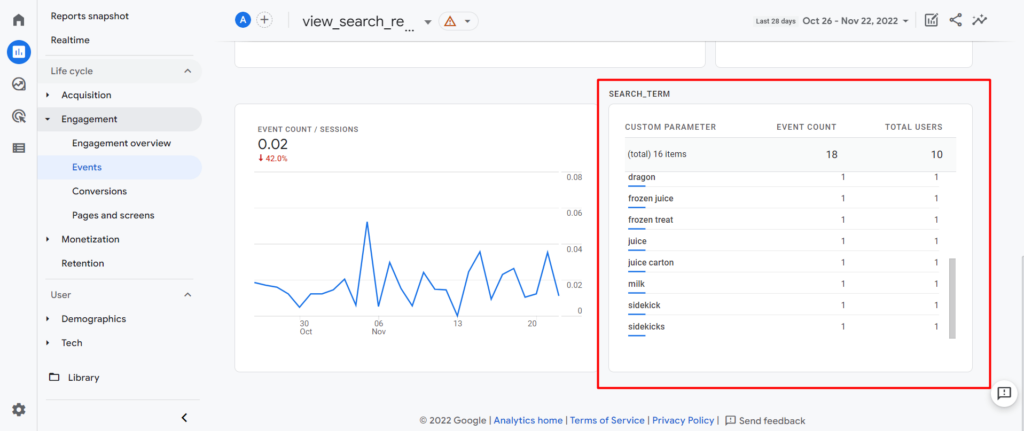
Scroll down to find the search_term box. Here, you can review all the search terms your users are searching on your site.
Find more step-by-step guides in our blog: How to Find Basic Data from UA in GA4.
Or sign up for some hands-on GA4 training. Our team at Evolve Marketing offers live, in-depth one on one training sessions so you can navigate GA4 like a pro. Contact us today for more information.
In Universal Analytics, the Assisted Conversions report showed the number of assisted conversions for each traffic channel. Assisted conversions are interaction points that lead to a conversion but are not the main source of the conversion point. To view this report, you could go to Conversions, then Multi-Channel Funnels, then click Assisted Conversions.
In addition to viewing the Assisted Conversions report, you might also view the Top Conversions Path report to see supporting data. This report showed you more details about the path taken by assisted conversion interactions before a user converted.
Follow this step-by-step guide to learn how to navigate to assisted conversion data in Google Analytics 4.
Before you can navigate to the Conversions paths report, you must first have e-commerce tracking and/or goal conversion tracking set up. Your Google Analytics 4 property needs to have conversion data before you can use the Conversion paths report.
Our team can help set up conversion configurations so that GA4 collects the data that is important to you and the success of your business. If your conversions are all set up, follow the steps below to navigate to the conversions path report.
In Google Analytics 4, the Assisted Conversions and Top Conversions Path reports from UA have been combined into one. To view the Conversions path report, click on Advertising in the left-hand navigation. Then click on Attribution and Conversion paths.
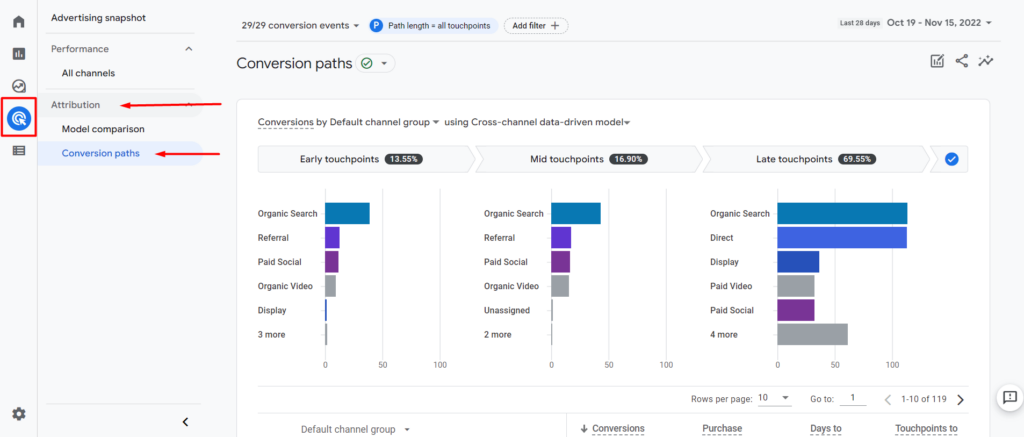
Here you will first see the data visualization section. This graph shows how much conversion credit each segment (touchpoint category) on the conversion path receives using the selected attribution model.
In the top left corner (to the right of the left-side navigation panel), you can use the drop-down to select which conversion data you want to view.
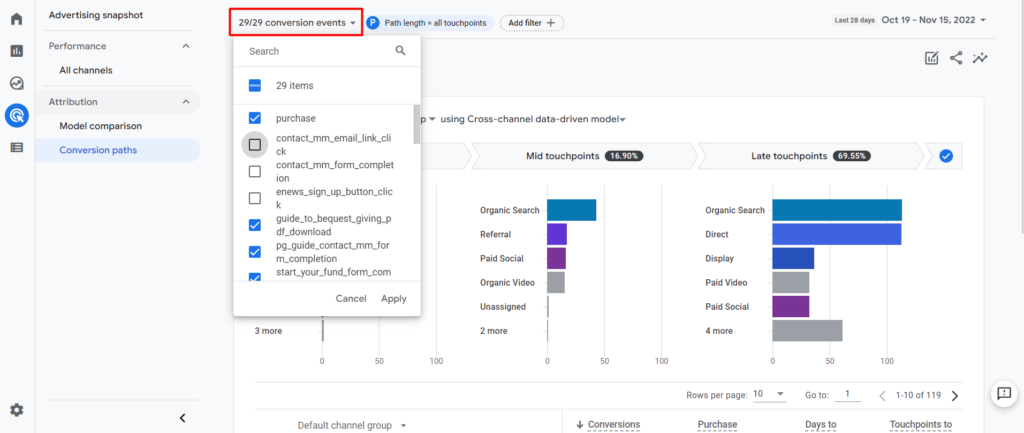
Once you have your conversions selected, you can change the selected dimension and the attribution model.
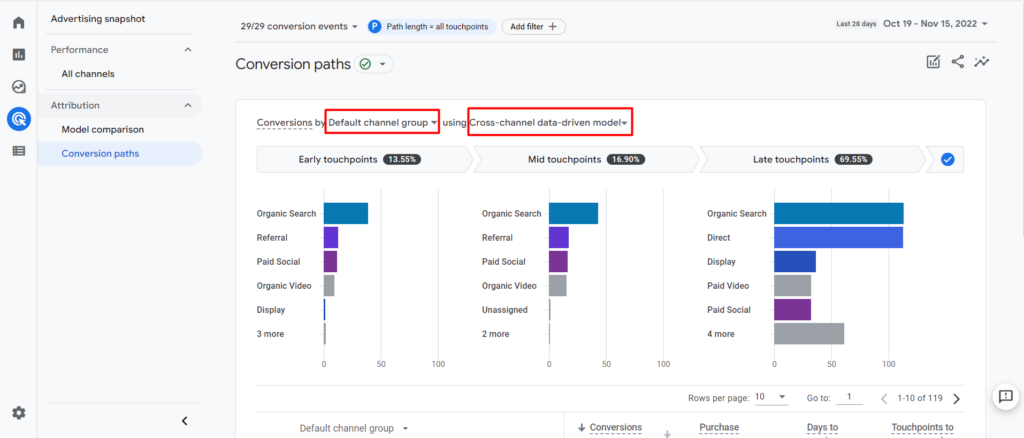
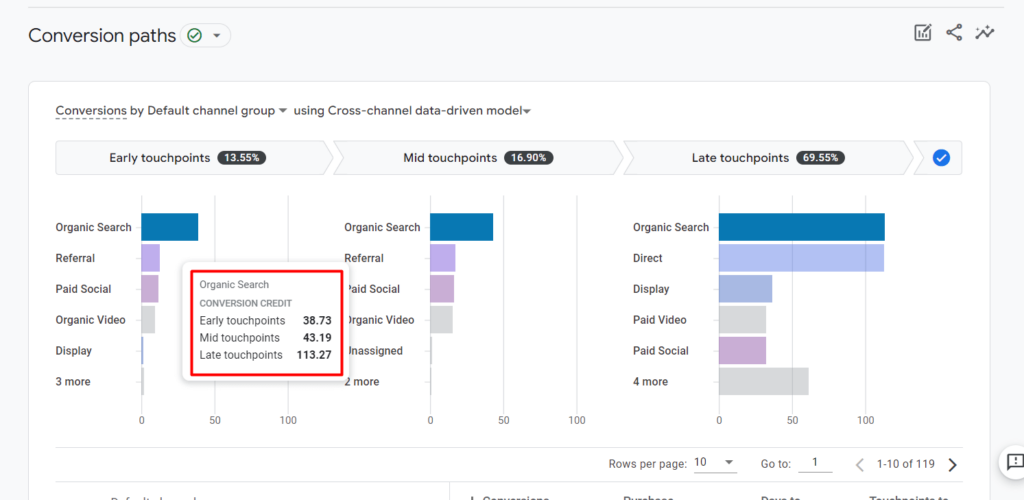
When you have selected your conversions, traffic dimension, and attribution model, the bar chart will show you how much conversion credit that particular dimension (channel, source, medium, campaign) receives while in that touchpoint phase of the conversion path. You can hover over a bar for more information.
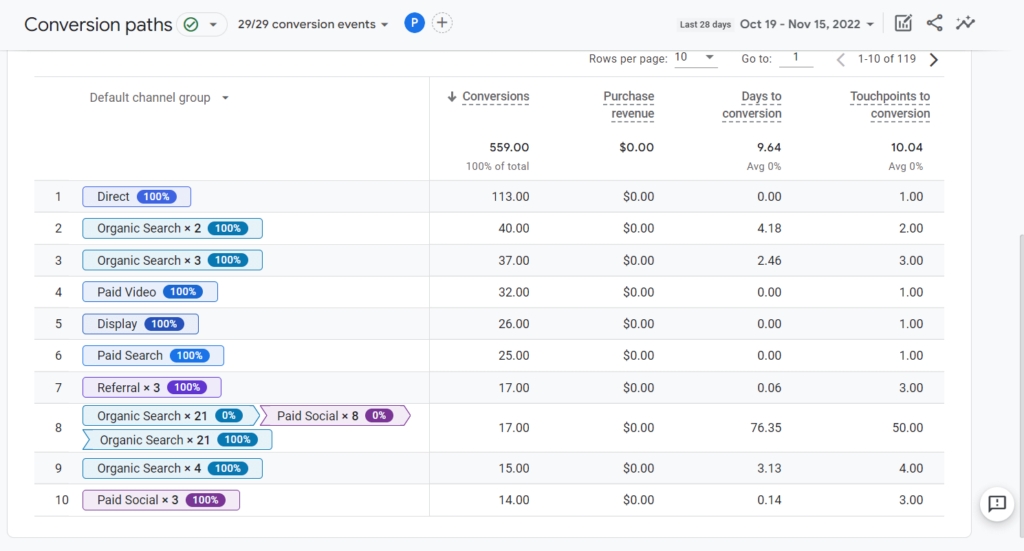
Below the data visualization graph, you will find the data table. The data table shows how the selected conversions are performing.
Check out our other step-by-step guides in our blog: How to Find Basic Data from UA in GA4.
If you’re looking for one-on-one, hands-on training, our team at Evolve Marketing also offers live, in-depth GA4 training sessions so you can navigate GA4 like a pro. Contact us today for more information.
In Universal Analytics (UA), there is a Google Ads Campaign report that allows you to see clicks, cost, CPC, and more for your connected Google Ads account. Luckily, there’s a very similar report in GA4 that allows you to see the same data.
Follow this step-by-step guide to see how to find Google Ads data in GA4.
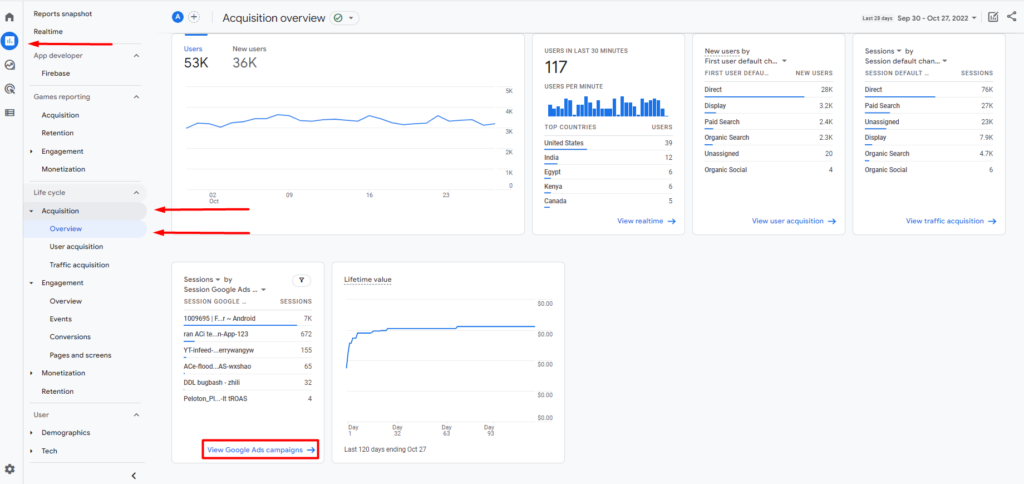
To get to the GA4 Google Ads report, first, click Reports in the left-hand navigation panel. Then under Life cycle, click Acquisition, then click Overview. Find the card that displays Sessions by Session Google Ads campaign and click View Google Ads campaigns in the bottom right corner.
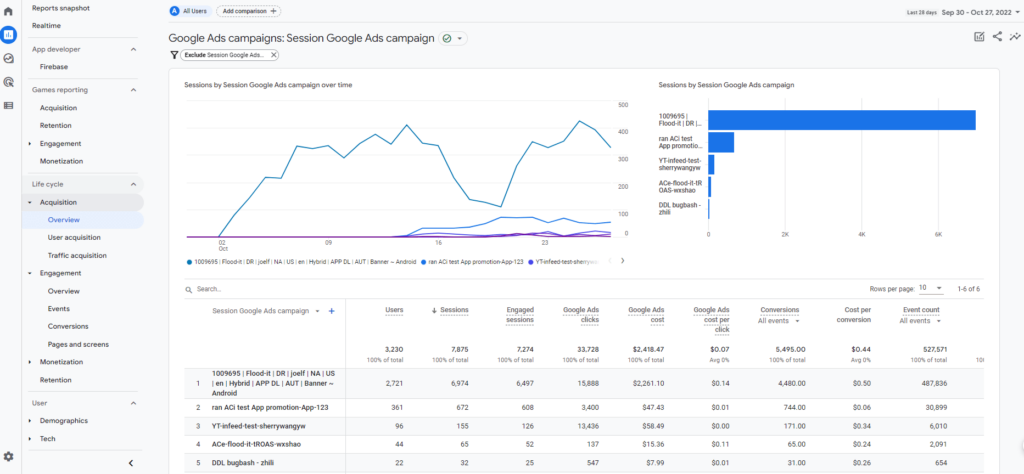
Here, you can see metrics similar to what was offered in the UA Google Ads report. For some reason, the GA4 report just doesn’t live in the navigation panel like it did in UA.
Want to learn how to find more reports you used to use in UA in GA4? Check out our other step-by-step guides in our blog: How to Find Basic Data from UA in GA4.
The Evolve Marketing team also offers GA4 training so you can navigate GA4 and analyze your data like a pro. Contact us today for more information.
The Source/Medium report in Universal Analytics is an extremely useful tool that quickly shows you the source and medium of your website traffic. This report can help you analyze your website traffic by attributing user, conversion, and other data to a specific audience.
Because this report offers such valuable information that helps us make important marketing decisions, we want to be able to see the same data in Google Analytics 4 (GA4).
Follow this step-by-step guide to find the source/medium report in GA4.
To see source/medium data in GA4, we’ll first want to navigate to the Traffic acquisition report.
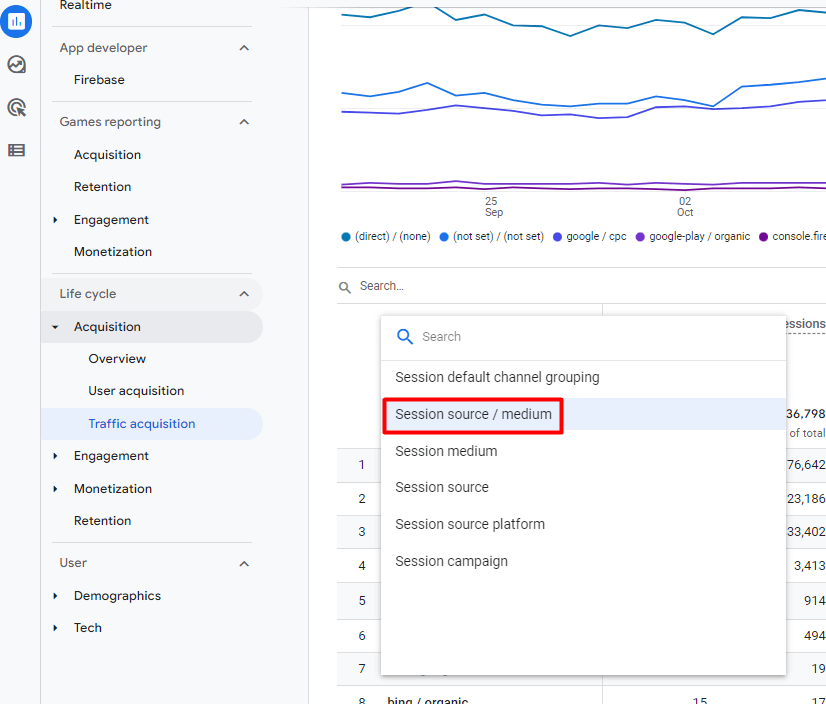
Select Session source/medium from the list of options.
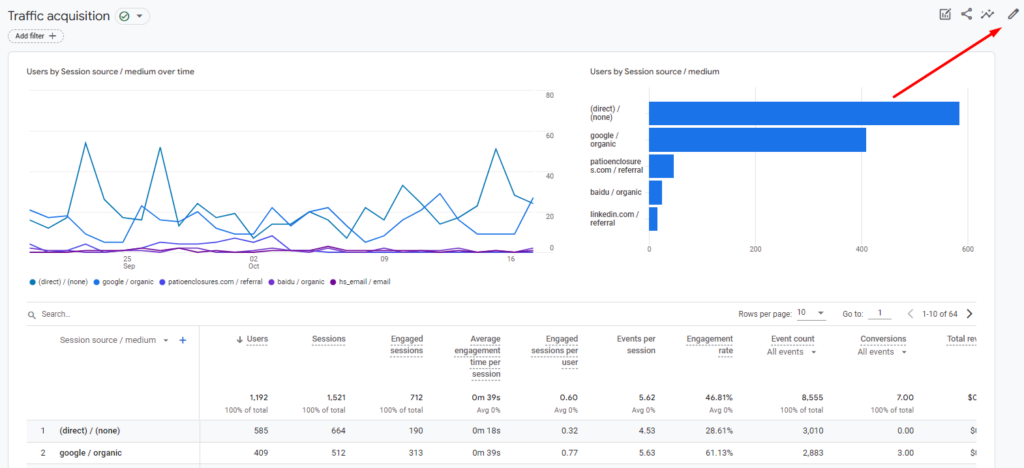
And now you can see source/medium data in GA4! If you want to save this report so it can live in your navigation panel for easy access, click the pencil icon in the top right corner.
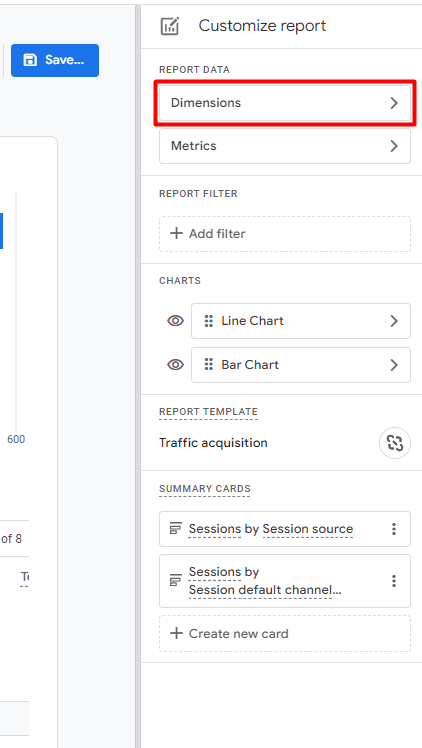
In the Customize report panel, select Dimensions.
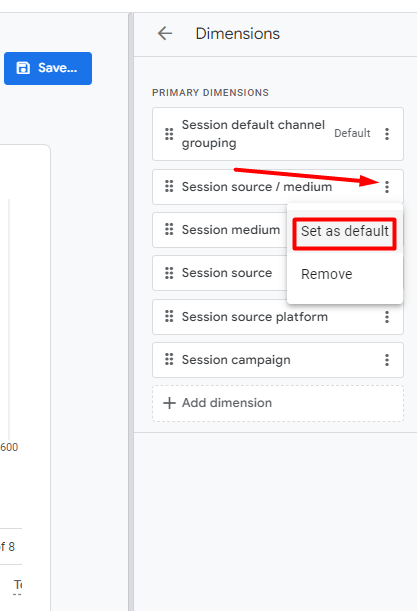
Locate the Session source/medium dimension and click the three vertical dots. From the drop-down menu, click Set as default.
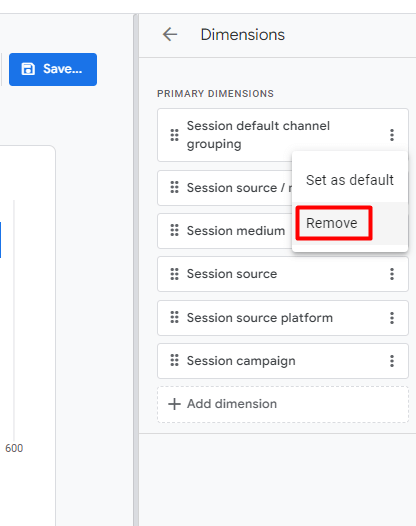
Remove any unnecessary dimensions by selecting the three vertical dots and clicking Remove. We’re going to keep the separate Session medium and Session source dimensions in case we want to look at these metrics individually in the future.
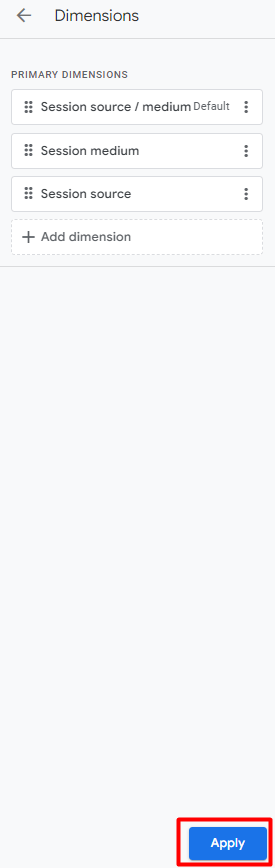
Click the Apply button in the bottom right corner.
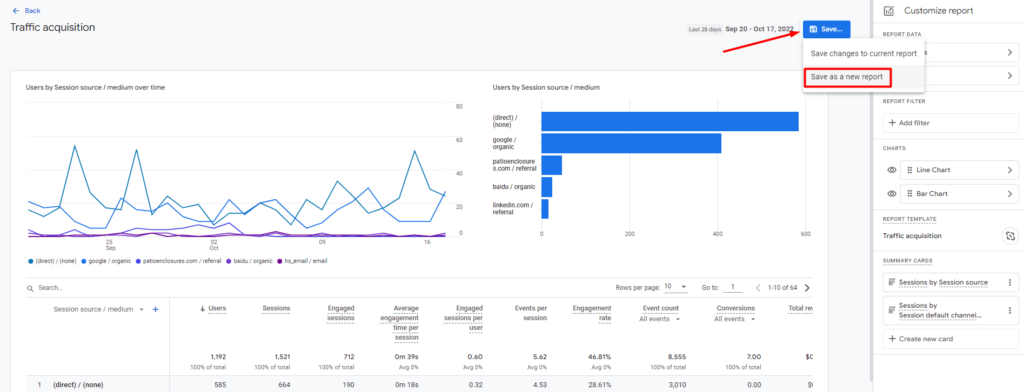
Click the blue Save… button and from the drop-down menu, select Save as a new report. This way, we won’t be replacing the Traffic acquisition report.
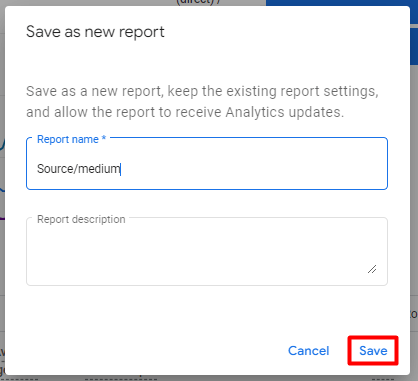
Name your report and give it a description if you would like. Click Save.
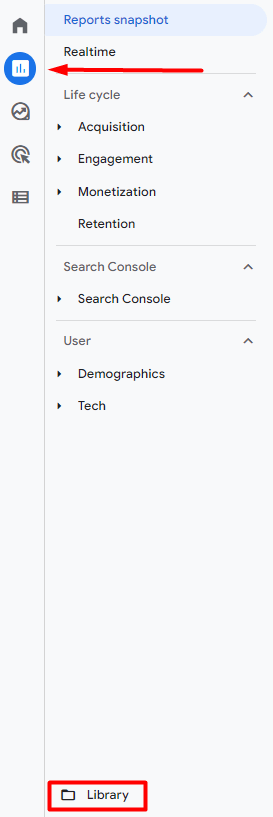
Now, to add this custom source/medium report to your navigation panel, head to the Library by clicking Reports then Library.
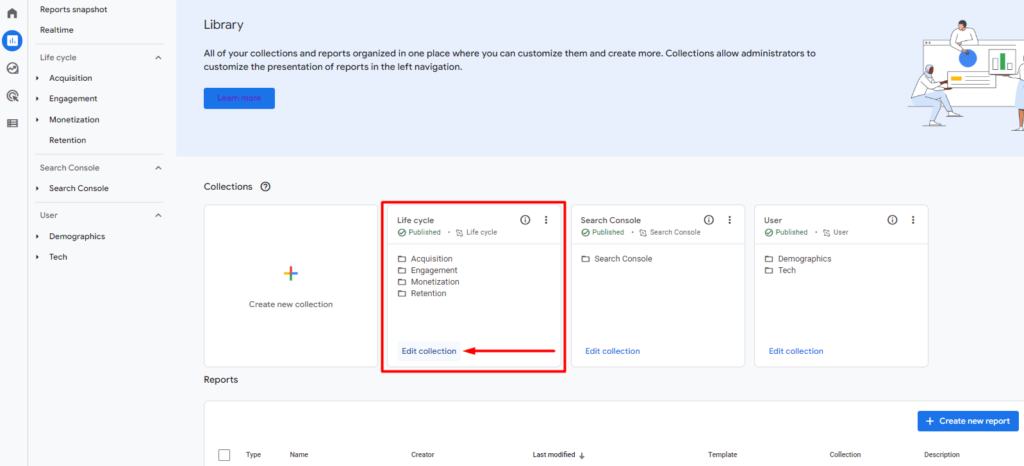
Select Edit collection under the Life cycle collection.
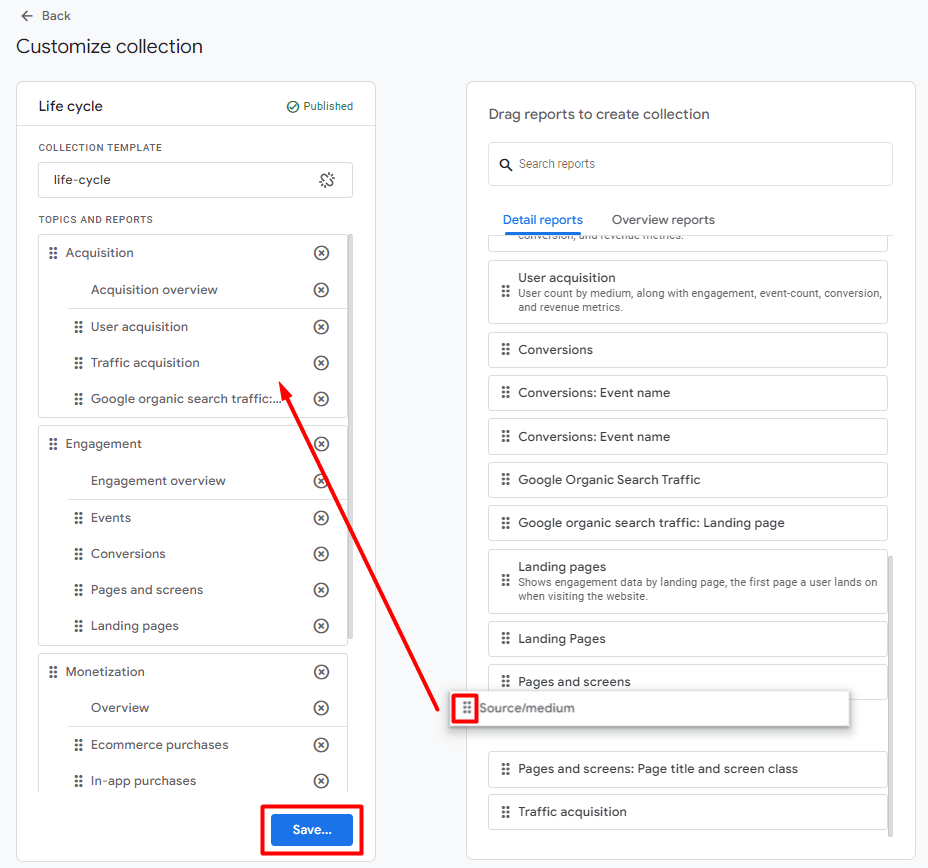
Using the six dots, you can drag and drop your source/medium report, which will be found in the list on the right, to your Life cycle collection on the left. Wherever you place it is where it will appear in your navigation panel. We chose to include it in the Acquisition section. When you’re finished, click Save. You’ll be prompted to save it as a new collection or save it to your current collection. Select Save to current collection.
Want to learn how to find other basic data from Universal Analytics in GA4? Check out our other step-by-step guides in our blog: How to Find Basic Data from UA in GA4.
Our team at Evolve Marketing also offers live, in-depth GA4 training so you can navigate GA4 like a pro. Contact us today for more information.
In Universal Analytics (UA), the Audience Overview report gives you a quick snapshot of who is visiting your site, where they are coming from, what type of device they are on, and how long they are staying. In GA4, this specific report type is no longer available. However, we can find similar data in the Engagement overview report.
It’s important to remember that data is collected differently in GA4. So, while we can review similar data in GA4, it’s not a 1-to-1 comparison.
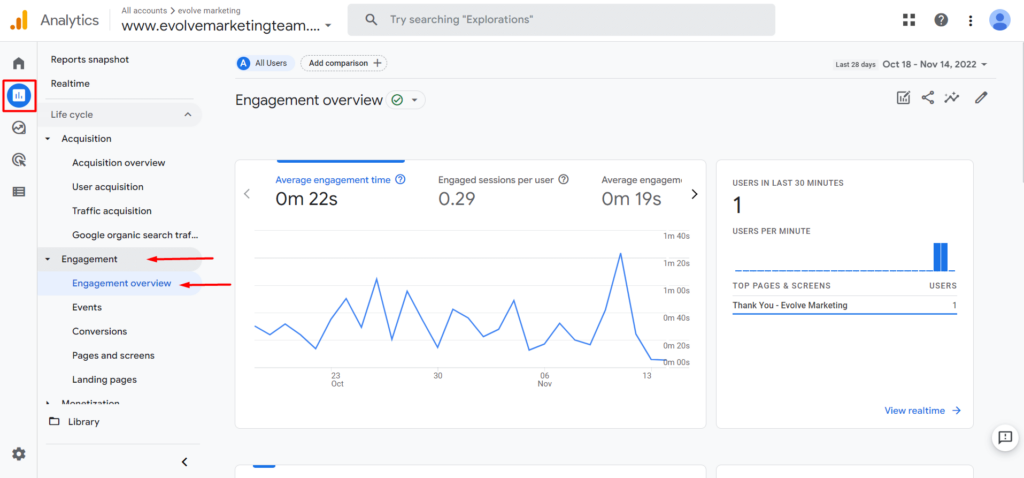
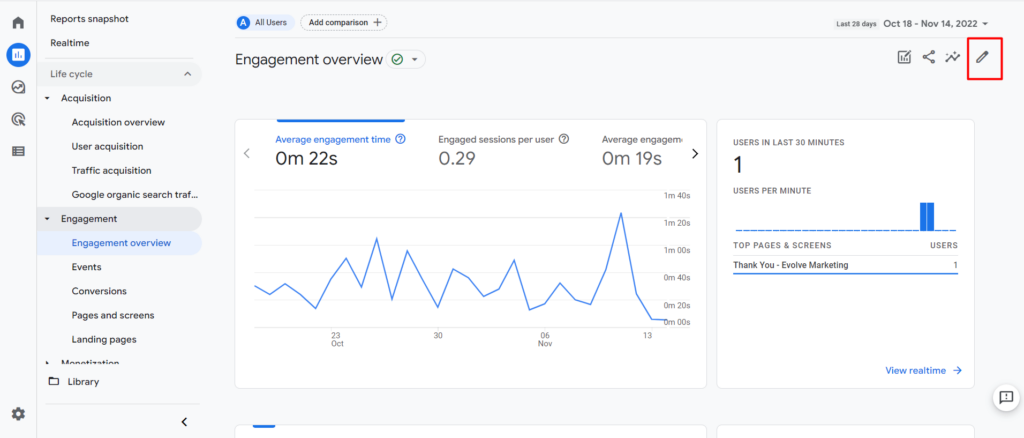
The Engagement overview report in GA4 is very similar to the Audience Overview report in UA. Here you can find views, event counts, average engagement time, number of engaged sessions per user, and average engagement time per session.
To navigate to the Engagement overview Report, go to Reports in the left navigation panel. Then click Engagements and Engagement overview.
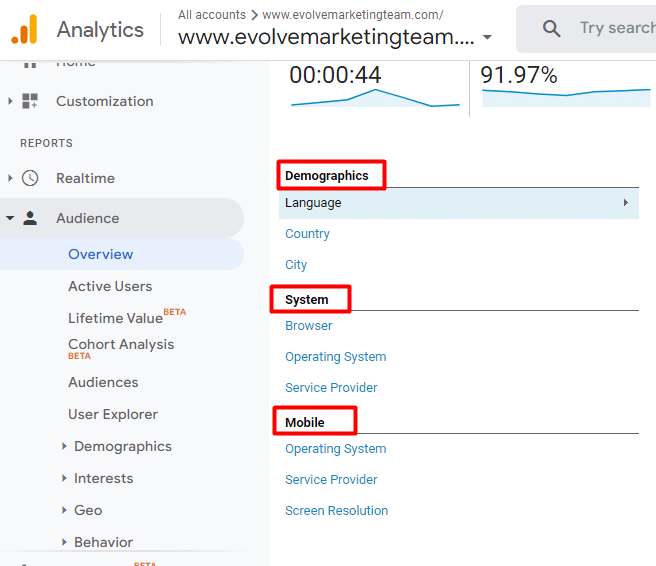
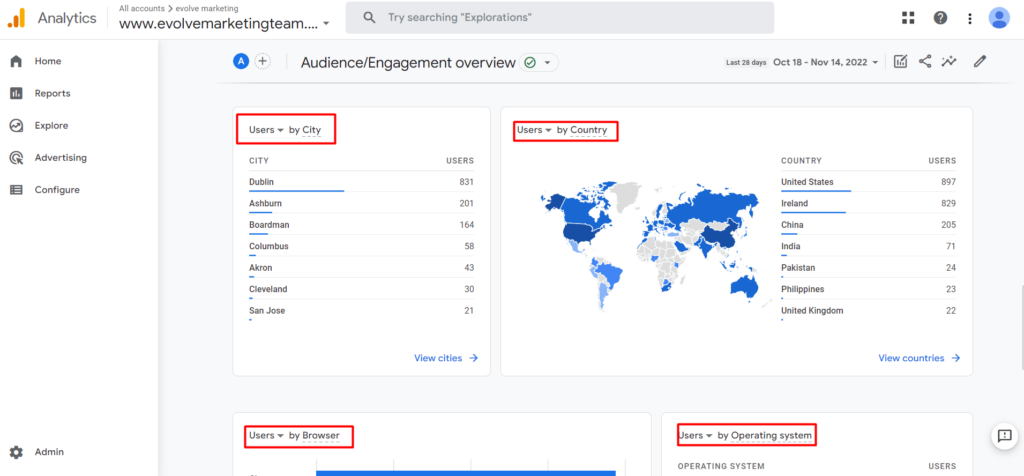
In the GA4 Engagement overview report, you can add additional cards to get similar data found in the Audience Overview report in UA. In the image below, you can see that the Audience Overview report in UA includes language, country, city, browser, operating system, service provider, and screen resolution data.
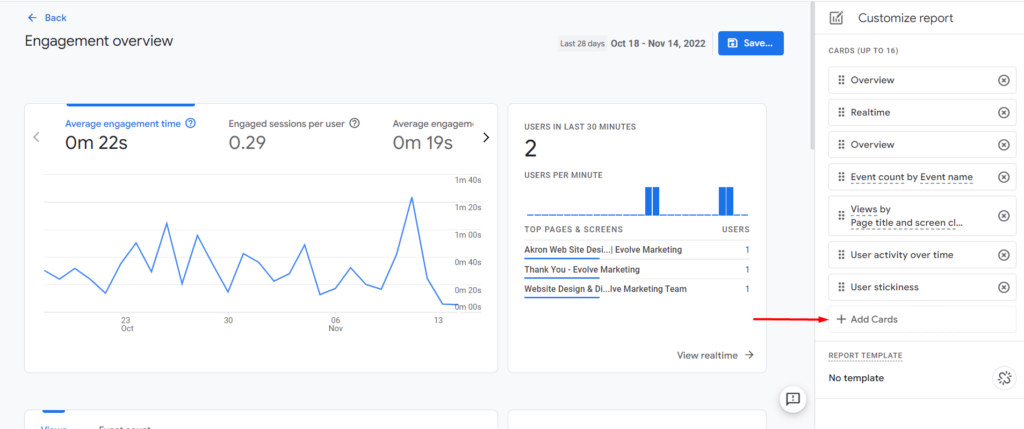
To add these same data points to your Engagement overview report in GA4, click on the pencil icon in the upper right corner of the Engagement overview report.
Then click on +Add Cards.
Here you can select Summary Cards of user data by different demographic details. To view data similar to the UA report, select:
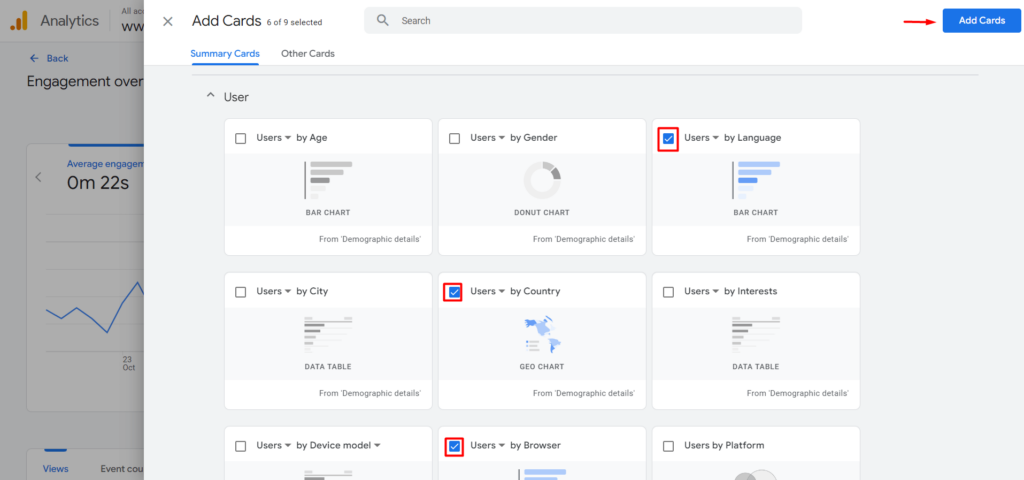
Then click the blue Add Cards button. Using the six dots, you can click on each Summary Card and rearrange them in your preferred order.
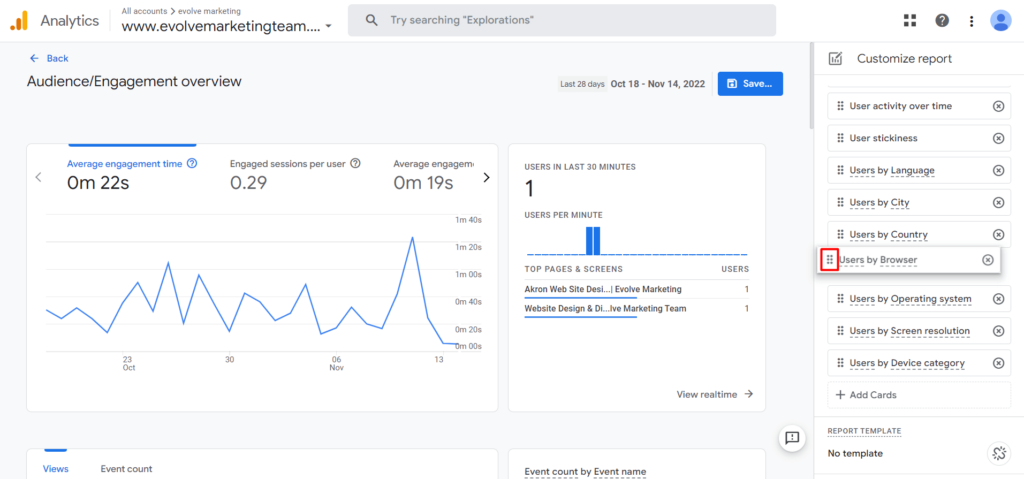
Once you’re done rearranging the summary cards, click the blue Save… button to save the report. It will give you the option to Save changes to current report or Save as a new report.
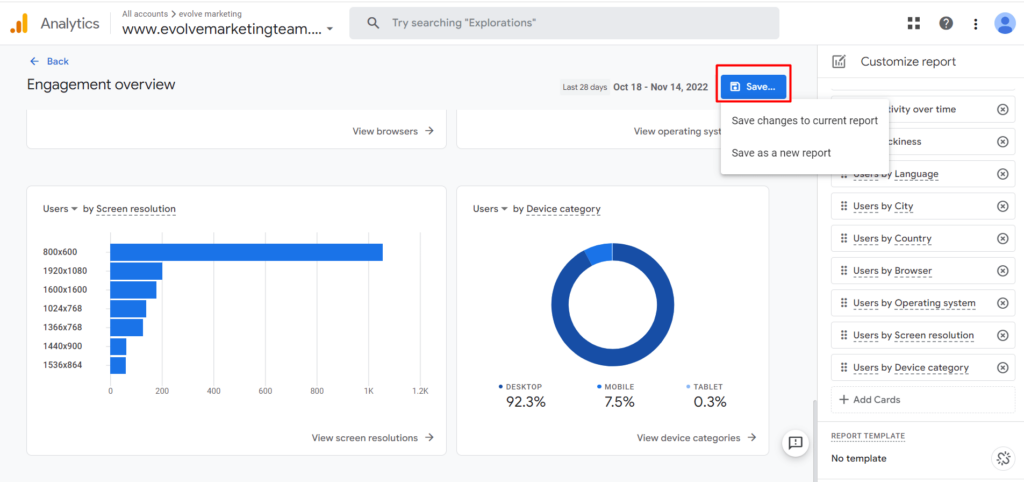
Once you save the report, click Back in the upper left corner.
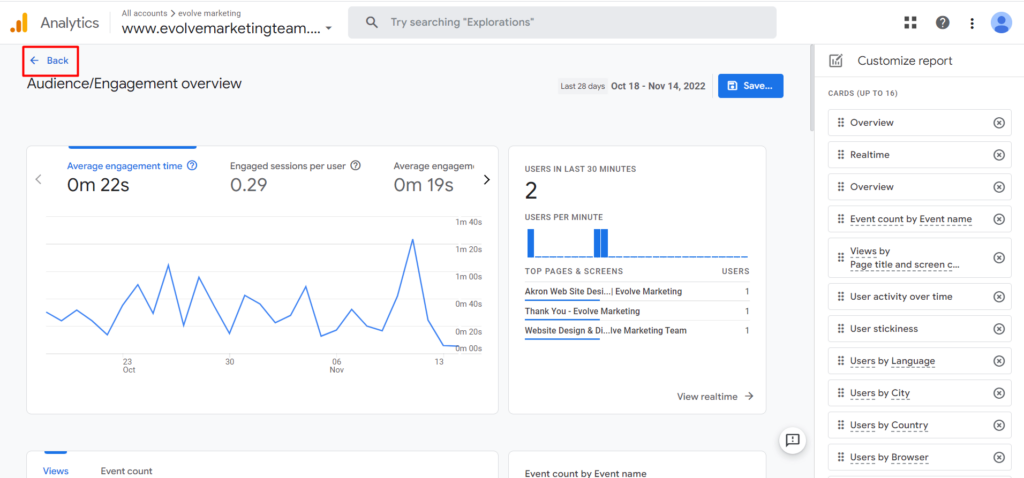
Congratulations, you did it! You can now view similar data to UA’s Audience Overview report.
Check out our other step-by-step guides in our blog: How to Find Basic Data from UA in GA4.
Our team at Evolve Marketing also offers in-depth, 1-on-1 GA4 training sessions so you can navigate GA4 like a pro. Contact us today for more information.
The New vs. Returning report in Universal Analytics is an easy and simple way to see Sessions, Bounce Rate, Goal Completions, and more for new (first-time) website visitors compared to returning visitors.
At the time that this blog post is being written, the GA4 equivalent of the New vs. Returning report isn’t a 1-to-1 match. But we can get to the same data in GA4 in a few different ways, either:
If you’re simply looking to see how many new users and returning users you had in a certain time frame, head to the Retention report.
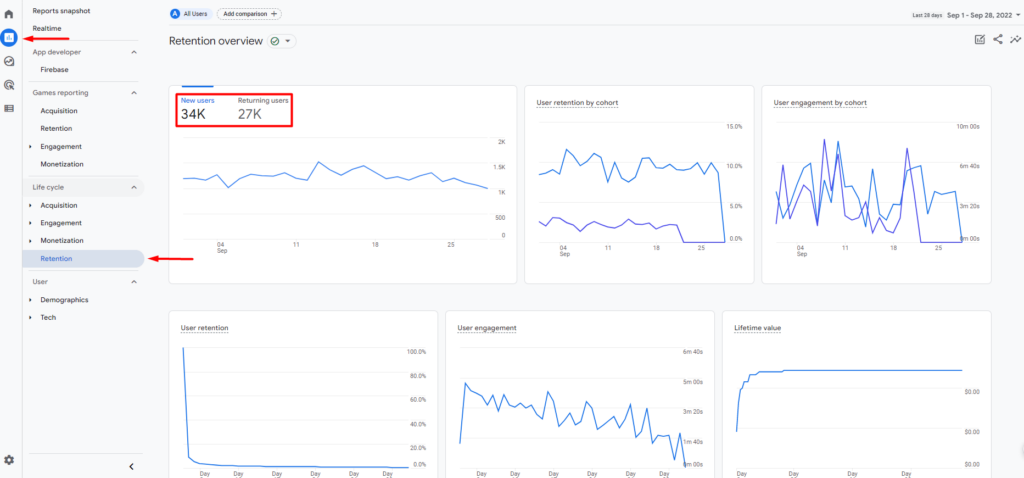
To find the Retention report, click Reports in the left-hand menu. Then under Life cycle, click Retention. Here, you can toggle between New users and Returning users.
If you want to see more in-depth data, click the pencil icon in the top right corner to add additional cards.
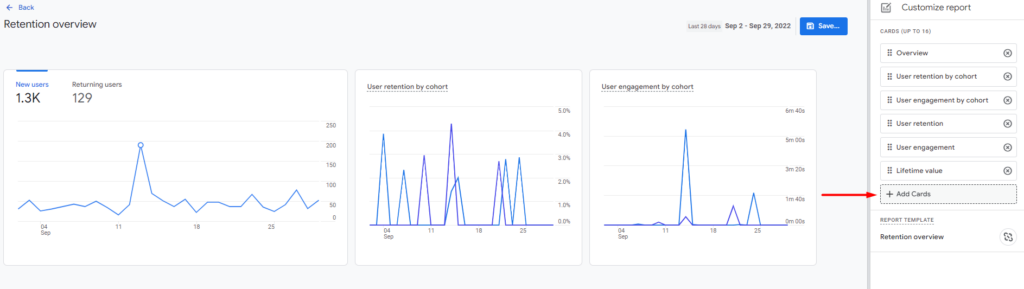
Then click +Add Cards.
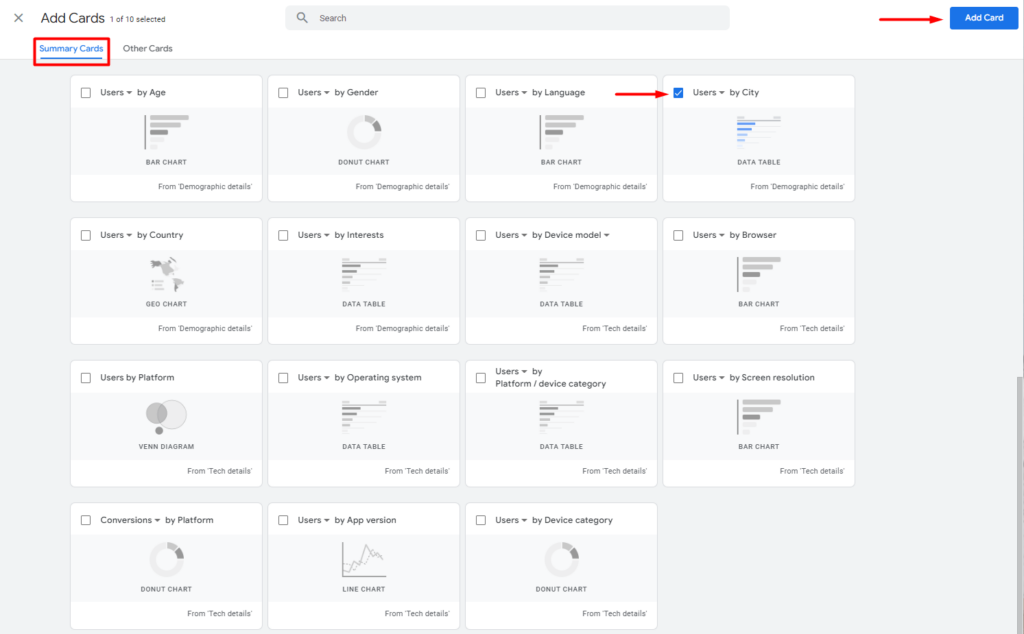
Scroll down to the User section in Summary Cards. You can choose from a variety of cards to add to your Retention report. For example, if you want to see what cities New Users vs. Returning Users are coming from, click the check box on the Users by City card and click Add Card in the top right corner.
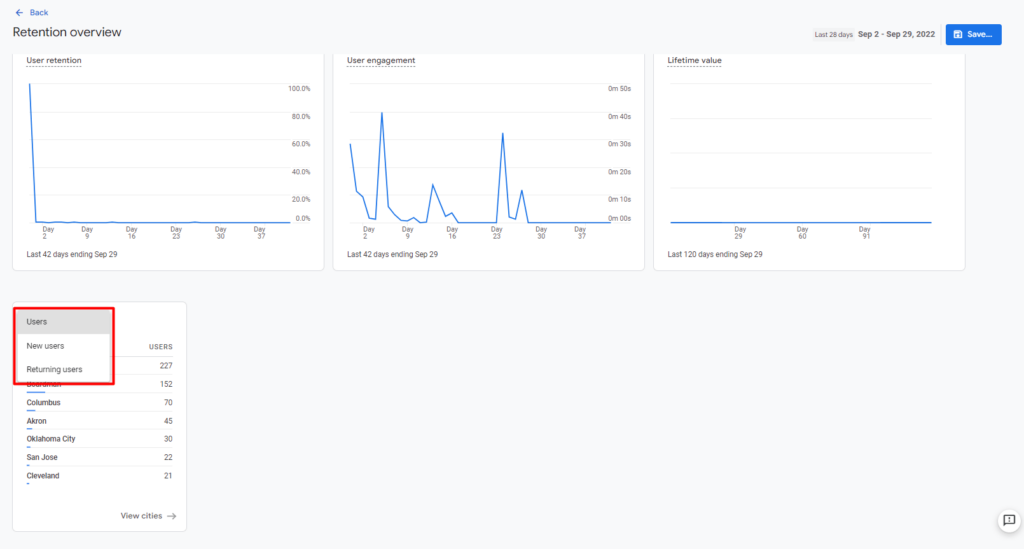
Once added to your report, you can toggle between New users and Returning users. You can use additional cards to further customize your report. Don’t forget to click Save and Save changes to current report if you want these cards to be in your Retention report for future use.
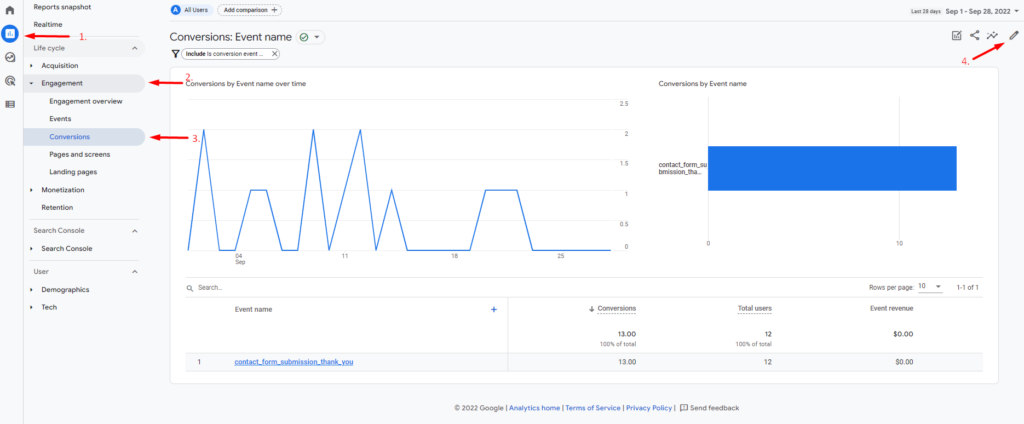
If you want to see conversions from new users vs. returning users, the easiest way is to customize your Conversions report, so let’s head there.
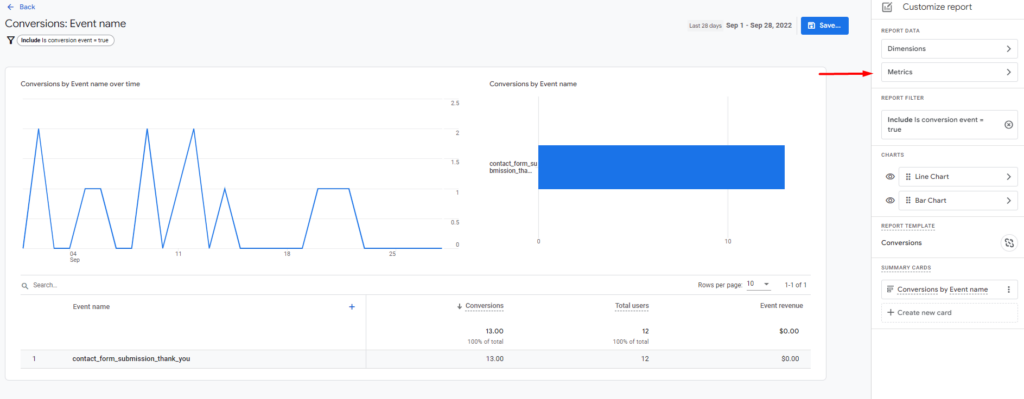
Click Metrics.
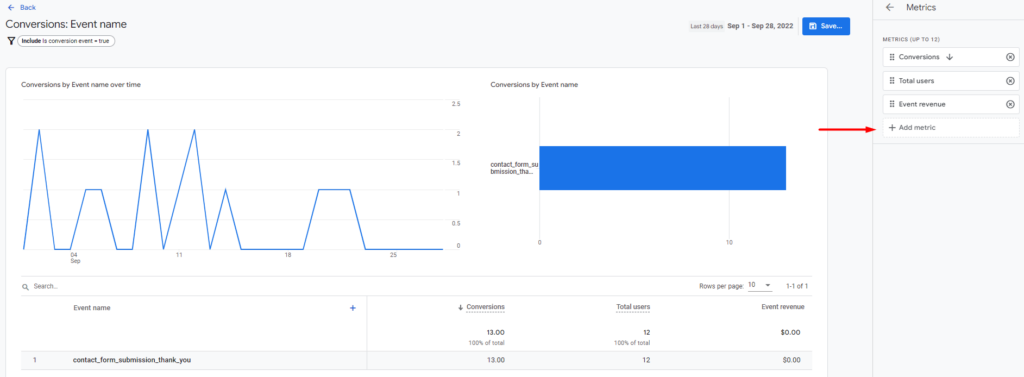
Then click +Add Metric and choose New users and Returning users from the list of options. Click the blue Apply button in the bottom right corner.
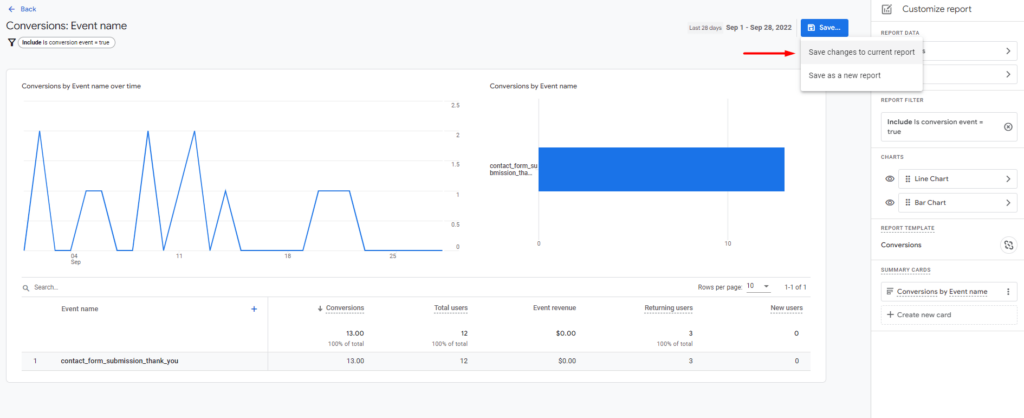
Be sure to save your changes by clicking the blue Save button in the top right corner. You can either save it as a new report or save your changes to the current report. If you save your changes to the current report, this data will be readily available whenever you view the Conversions report.
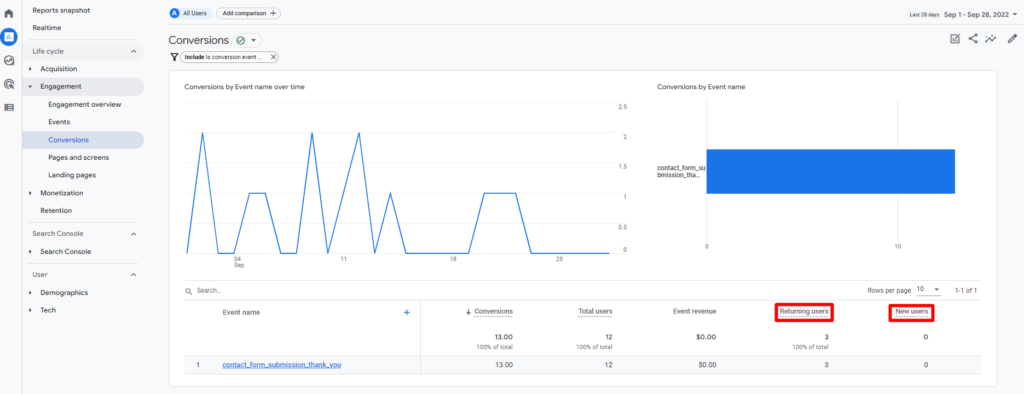
Now you can see how many conversions are from returning users compared to new users, just like you could in Universal Analytics.
Want to find data in GA4 that you were used to seeing in Universal Analytics? We have several guides that will walk you through each step in our blog: How to Find Basic Data from UA in GA4.
The team at Evolve Marketing also offers live GA4 training so you can analyze data in GA4 like a pro. Contact us today to get more information or to sign up for a session.