While GA4 may no longer be in beta, Google is often implementing changes and making updates. The Evolve digital marketing team will be regularly monitoring these changes and updating our blogs to provide the most accurate, up-to-date information regarding GA4.
Although these two properties provide similar data, accessing basic reports and data in GA4 differs from UA. In this blog post, we will discuss:
- Key Differences in UA and GA4’s Reporting Interfaces
- UA Reporting Interface
- GA4 Reporting Interface
- Finding UA Data in GA4 Reports
Key Differences Between UA and GA4’s Reporting Interfaces
Although the reporting interfaces in UA and GA4 are similar, there are differences that can make locating basic data in GA4 challenging. Below is a side-by-side comparison of the navigation panel in GA4 compared to the navigation panel in UA.
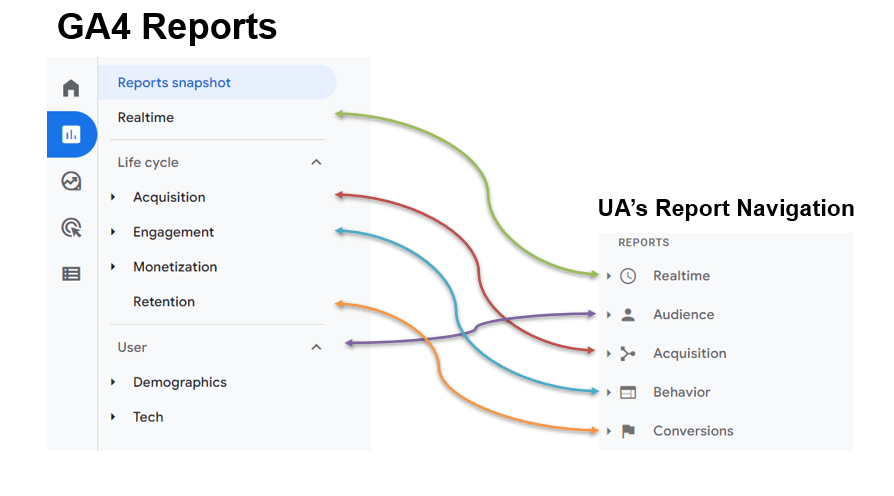
Navigation Report Categories
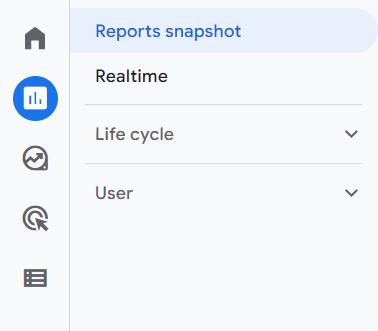
Another difference between UA and GA4 is the primary report categories in the left-hand navigation panel. UA had five main report categories: Realtime, Audience, Acquisition, Behavior, and Conversions, but GA4 only offers four. The four report categories in GA4 consist of Reports Snapshot, Realtime, Life Cycle, and User.
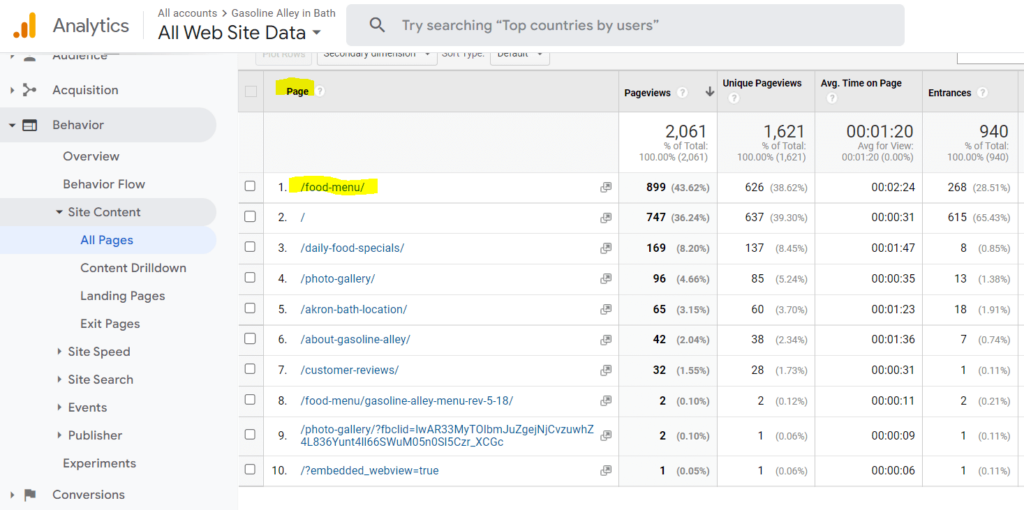
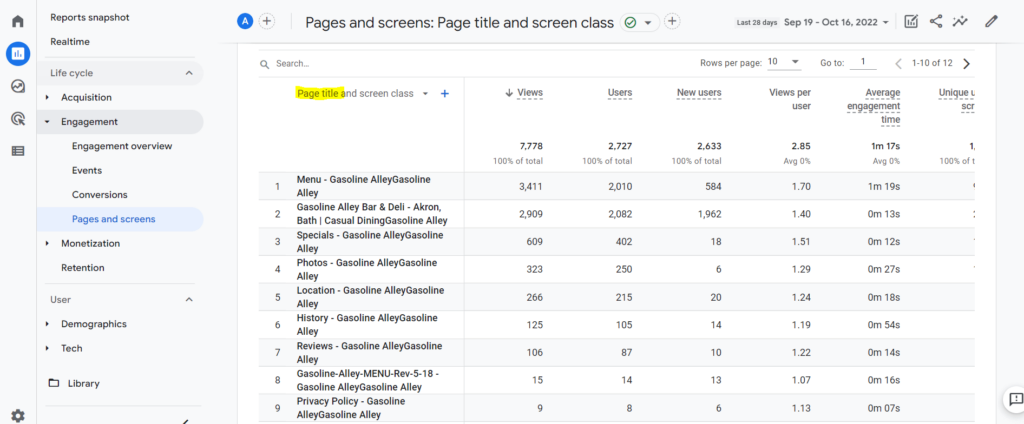
Page Value
In the UA reporting interface, Page Path is the page value for the default reports. But, in GA4, Page Title is the page value for the default reports. However, you can switch it to Page Path if that is what you were used to reporting on in UA.
UA Reporting Interface Overview
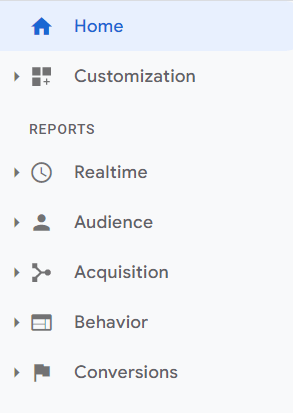
In UA, you could find the main reporting interface and standard reports in the property view. UA’s standard reports were grouped into five buckets:
- Realtime
- Audience
- Acquisition
- Behavior
- Conversions
Each reporting bucket had a drop-down with various related reports.
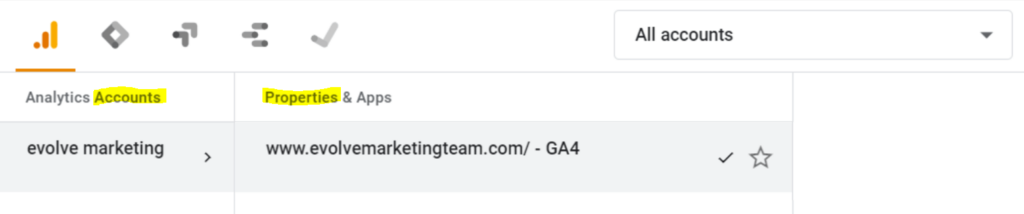
To navigate to the UA reporting interface, go to your Google Analytics account, select the Property, and then chose the desired data View.
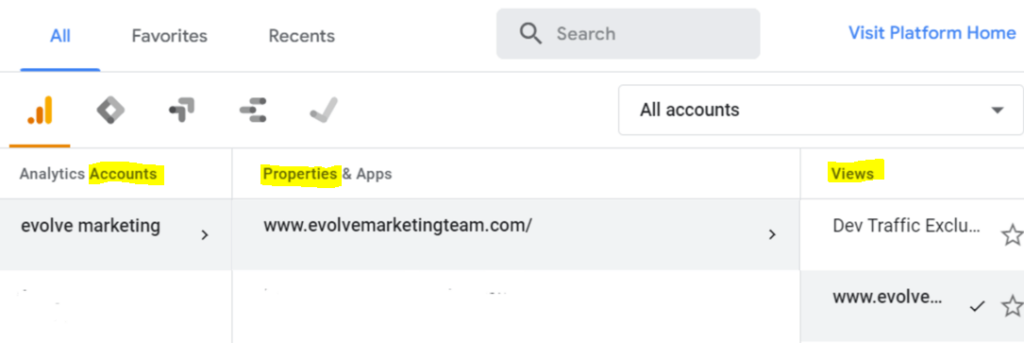
Once in the View, you will see the reporting navigation on the left side of the screen.
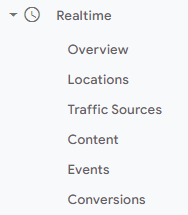
Realtime Reports
The Realtime reports allowed you to monitor activity as it was happening on your site or app. The Realtime reports included:
- the top-ten pages on which users are active
- the source for the users on each page
- the number of active users on each page
The Realtime reports showed if a user triggered an event or pageview within the past five minutes. This report provided immediate insight into how users were interacting with your content.
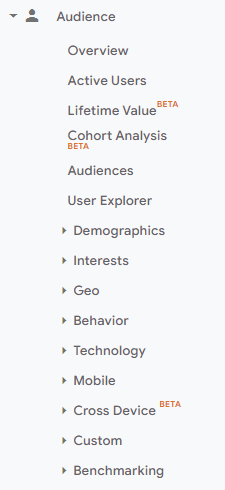
Audience Reports
The Audience reports allowed you to instantly analyze their target audience. These reports provided insight into user characteristics, including their interests, intentions, and behaviors.
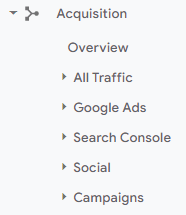
Acquisition Reports
The Acquisition reports showed where the traffic originated, the methods the user took to arrive at the site or app, and the marketing efforts taken used to drive the user traffic.
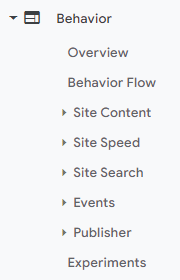
Behavior Reports
The Behavior reports showed site engagement, including if users left the website after viewing only a single page (known as Bounce Rate), if they viewed multiple pages, and how much time they spent on the site.
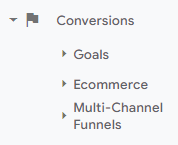
Conversion Reports
The conversion reports provided goal and transaction data, allowing you to see if you were generating revenue at the desired rate.
GA4 Reporting Interface Overview
In GA4, the reporting interface is found under the account Property. For the standard reports, you’ll see that they are now classified into two major buckets: the Life cycle collection and the User collection. To navigate to the GA4 reporting interface, go to your Google Analytics account and select the GA4 property.
This will take you to the home screen, where you can find the main navigation on the left.
Reports Snapshot & Realtime
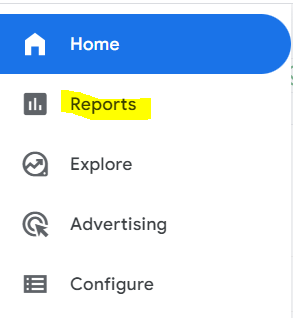
Just like in UA, you can access the Report Snapshot and Realtime from the left-side navigation.
When you select Reports in the left-side navigation, you’re taken to a reporting overview page called the Reports snapshot.
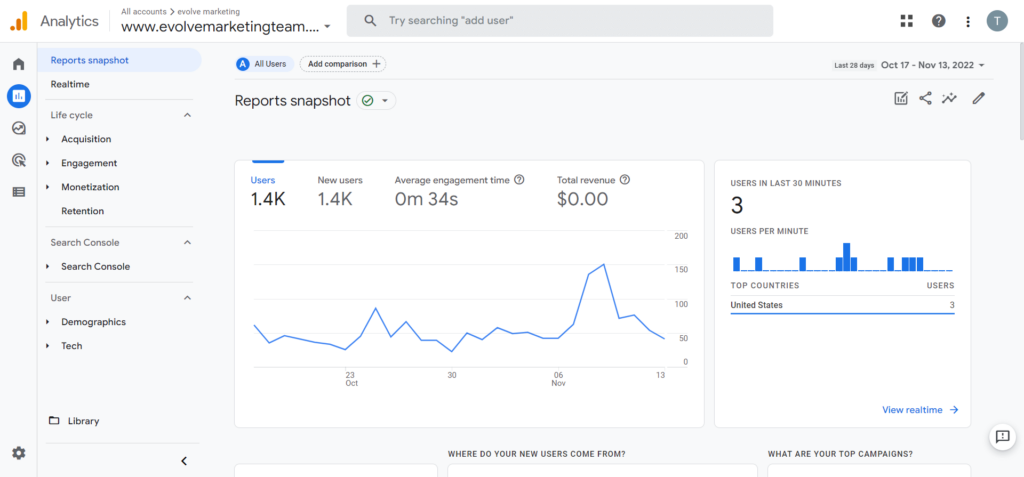
Realtime in GA4 is like it was in UA. It allows you to monitor the activity on your website or app as it occurs. The difference is the GA4 Realtime report includes user activity for the last 30 minutes instead of the five minutes.
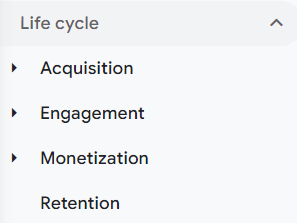
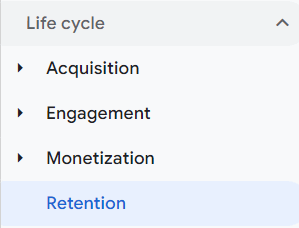
Life Cycle Reports
The life cycle collection of reports helps you visualize and analyze data according to the four stages of the customer lifecycle: Acquisition, Engagement, Monetization, and Retention.
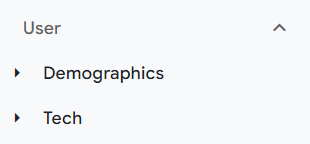
User Reports
The User collection of reports provides insights into the makeup of users visiting your website. In this drop-down, there are reports for Demographics and Tech.
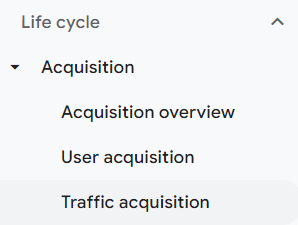
Acquisition Reports
In GA4, the Acquisition reports are where you can retrieve traffic data to see how users are coming to your website. You can use this data to make future marketing campaign decisions and to determine the efficiency of your website and your current marketing efforts.
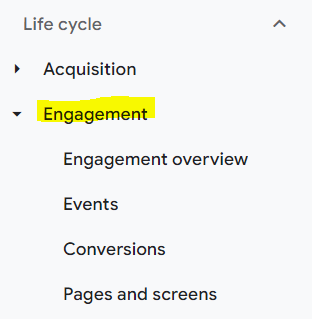
Engagement Reports
The Engagement reports show user activity that took place on your site or app. The Engagement reports include the following: the Overview report, the Events report, the Conversions report, and the Pages and screens report. These reports allow you to measure user engagement by analyzing events and conversions to see the web pages and app screens users visit.
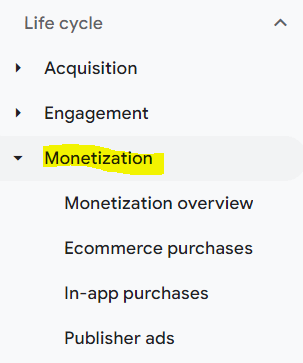
Monetization Reports
The Monetization reports show the revenue generated from the items, ads, and subscriptions on your website or app. Monetization reports include data from eCommerce purchases, in-app purchases, and publisher ads. You must set up revenue-based events before data can be collected and analyzed in this report.
Retention Reports
The Retention report allows you to analyze and understand how frequently and for how long users engage with a website or app after their first visit. In this stage, you can also analyze the value of users based on the additional revenue generated after their first visit to the site or app.
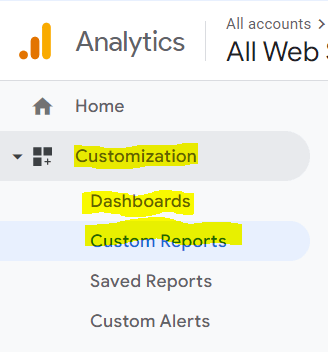
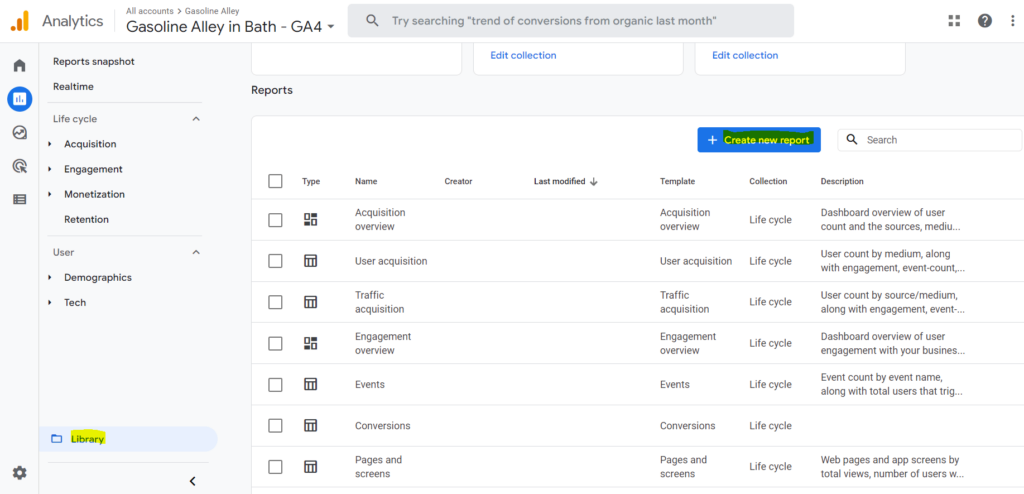
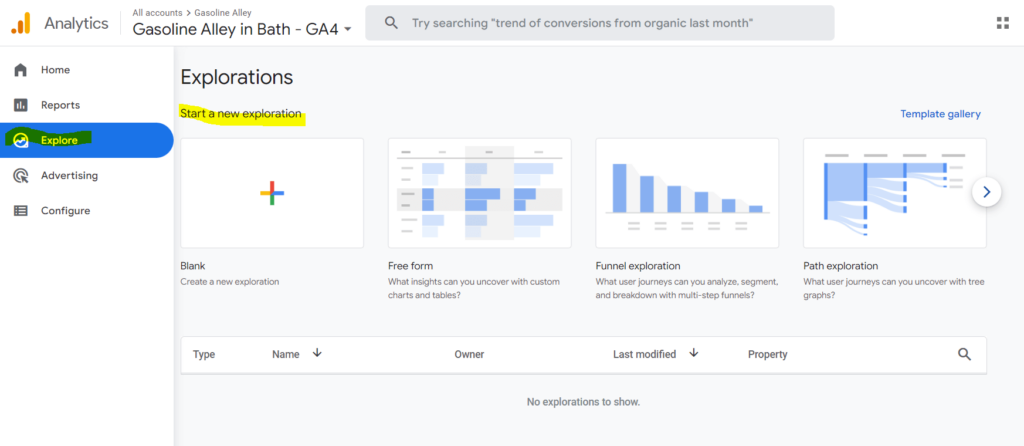
Custom Reports
While UA offered custom reports, the process of creating them has changed in GA4. The UA reporting interface offered custom dashboards and custom reports in the Customization tab of the main navigation panel. However, in the GA4 reporting interface, you can create new reports in the reporting library and find dashboards in the new Explorations tool.
Finding UA Data in GA4 Reports
Use the charts below for a quick breakdown on where to find UA data/reports in GA4. Click on each report title to view detailed, step-by-step instructions on finding specific data in GA4.
Top Pages
| Where to Find in UA | Where to Find in GA4 |
| Behavior > Site Content > Landing Pages | Reports > Engagement > Pages and Screens |
Top Landing Pages
| Where to Find in UA | Where to Find in GA4 |
| Behavior > Site Content > All Pages | Reports > Library > Create New Report > Detailed Report > Pages and Screens Template > Add Landing page + query string as your default dimension > Save Report |
Audience Overview
The audience overview report type is no longer available. However, we can find similar data in the Engagement overview report.
| Where to Find in UA | Where to Find in GA4 |
| Audience > Overview | Reports > Engagement > Overview |
New vs. Returning Users
Analytics identifies a "New User" as anyone who does not have BOTH a Googly Analytics cookie and Client ID from a site or app. Users who already have these are Returning Users.
| Where to Find in UA | Where to Find in GA4 |
| Audience > Behavior > New vs. Returning | Reports > Retention |
Bounce Rate
| Where to Find in UA | Where to Find in GA4 |
| Audience > Overview | Reports > Engagement > Pages and Screens > Click the Pencil Icon to Edit Report > Add Metric > Bounce Rate > Save |
Traffic by Source
| Where to Find in UA | Where to Find in GA4 |
| Acquisition > All Traffic > Source/Medium | Acquisition > Traffic Acquisition > Select "Session Source/Medium" from the drop down |
Google Ads
| Where to Find in UA | Where to Find in GA4 |
| Acquisition > Campaigns > All Campaigns | Acquisition > Overview > at the bottom where is says "Sessions by Session Google Ads Campaign", select "View Google Ads Campaign" |
Assisted Conversions
| Where to Find in UA | Where to Find in GA4 |
| Conversions > Multi Channel Funnels > Assisted Conversions | Advertising > Attribution > Conversion Paths |
Site Search Results
You must enable certain settings before you can view the site search report. Follow this step-by-step guide to enable and view your Google Analytics site search report.
| Where to Find in UA | Where to Find in GA4 |
| Behavior > Site Search > Overview | Reports > Engagement > Events > view_search_results > search_term |
Conversions/Goals
| Where to Find in UA | Where to Find in GA4 |
| Conversions > Goals > Overview | Reports > Engagement > Conversions |
Device
| Where to Find in UA | Where to Find in GA4 |
| Audience > Mobile > Overview | Reports > User > Tech > Tech Details > Select "Device Category" from the drop down |
Operating System & Conversions by Browser
| Where to Find in UA | Where to Find in GA4 |
| Audience > Technology > Browser & OS | Reports > User > Tech > Tech Details |
Conversions by Source/Medium
| Where to Find in UA | Where to Find in GA4 |
| Acquisition > All Traffic > Source Medium | Reports > Acquisition > User Acquisition > Select "Session Source/Medium" from the drop down > Select each event/conversion by using the drop down in the event and conversions columns |
Conversions by UTM Parameters
| Where to Find in UA | Where to Find in GA4 |
| Acquisition > All Traffic > Source/Medium > Sort by Secondary Dimension > Campaign/Content | Reports > Acquisition > Traffic Acquisition > First Drop Down: Select Session Source Medium > Select the "+" and select "Traffic Source" > Add "Session Campaign" or "Session Manual Ad Content" > Select each event/conversion by using the drop down in the event and conversions columns |
Learn More with Evolve’s GA4 Training
Learning how to operate the new Google Analytics 4 property to locate data can be very overwhelming. The team at Evolve Marketing would be happy to assist you with any GA4 questions you may have.
If you’re located in Akron, Ohio, or the Northeast Ohio area, we offer hands-on, in-person or virtual Google Analytics interface walkthrough training for you and/or your team. You’ll learn all things GA4, including how to create GA4 custom reports.
Learn more about our GA4 training sessions by contacting us today or by viewing our other helpful GA4 blog posts.