What Is Universal Analytics?
Universal Analytics, also known as GA3 or UA, was first introduced in the fall of 2012. Universal Analytics used a session-based model to collect data, which is different from the way Google Analytics 4 collects data. We’ll dive deeper into the differences in data collection later in this blog post.
Universal Analytics offered users the ability to create various reports based on unique aspects of their business model and the behavior of users. Universal Analytics also eliminated duplicate session reporting, which allowed metrics to be imported from outside sources to gain more insight into customer behavior.
What Is Google Analytics 4?
The future of Google Analytics is continuously evolving. The latest version is Google Analytics 4, also referred to as GA4. Google released Google Analytics 4 in beta in late 2020 and it’s still considered to be in beta mode. It’s expected to be released as a stable version at the end of 2022. While in beta mode, Google has made several updates and changes to Google Analytics 4 as they prepare for it to fully replace Universal Analytics on July 1, 2023.
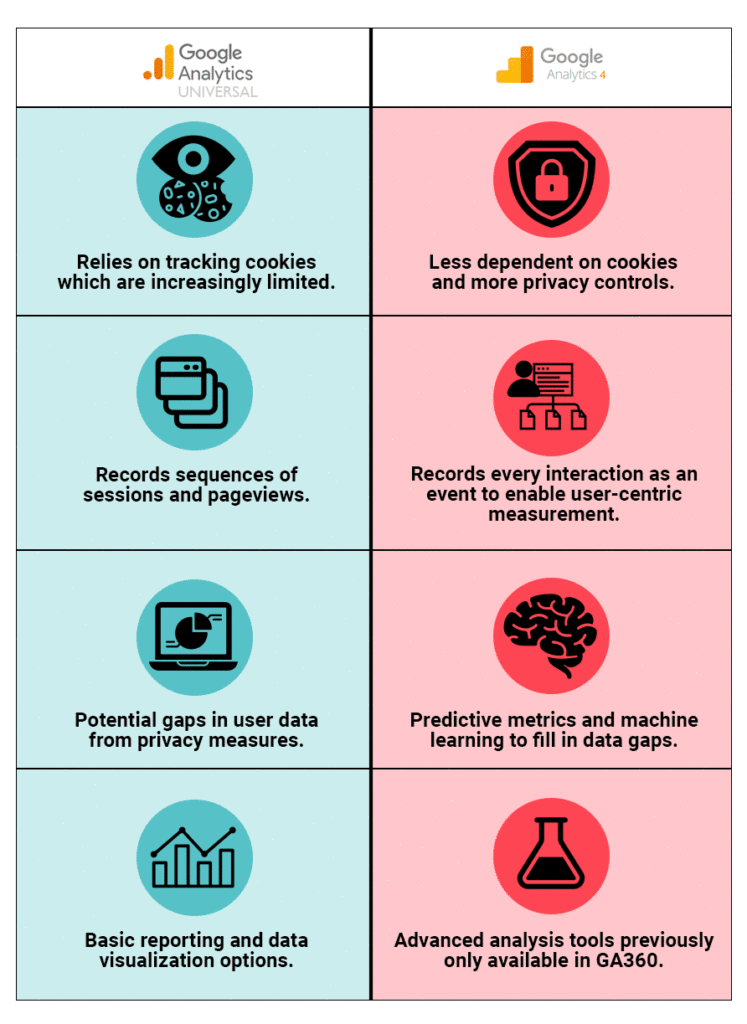
Google Analytics 4 enables traffic and engagement across websites and apps to be measured in one place. This new property uses an event-based measurement model, meaning every interaction is collected as an event, including page views, first visits, and more.
Google Analytics 4 allows marketers to better understand user journeys with enhanced tools and features to edit, correct, and fine-tune how events are tracked in analytics without editing the on-site code.
Because the July 1st deadline is quickly approaching, it’s crucial to understand Google Analytics 4 to ensure no website data is lost or missed because after that date, website data will no longer be tracked in Universal Analytics.

Differences in Google Analytics 4 (GA4) vs Universal Analytics (UA)
Although Universal Analytics and Google Analytics 4 essentially provide the same information, these two properties have many differences. The differences between these properties include:
- Measurement Model
- Tracking IDs
- Account Structure
- Conversions
- Reporting Interface
- New Metrics
- Removed Metrics
- Segments
- Events and Goals
- Cross-Platform and Cross-Device Tracking
- DebugView Report
- IP Anonymization
- Bounce Rate
Measurement Models
The biggest difference between Google Analytics 4 and Universal Analytics are their measurement models.

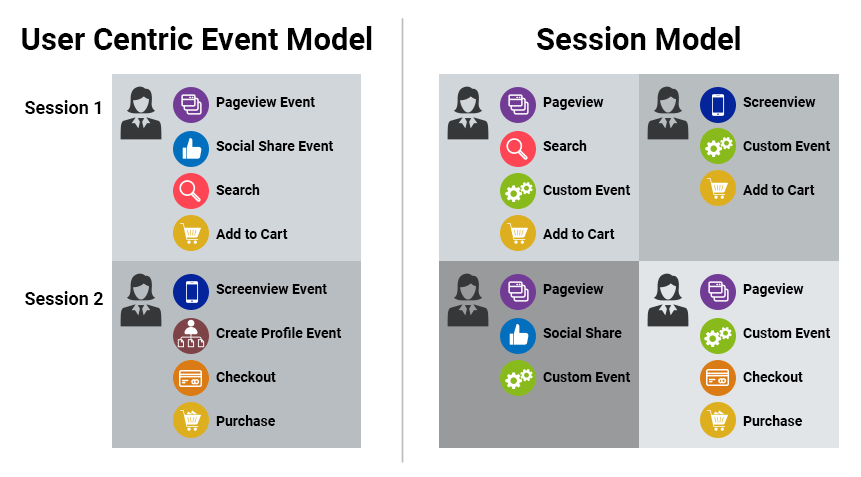
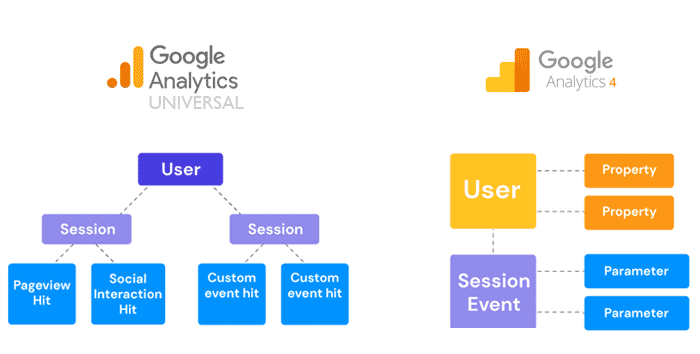
Universal Analytics used a session-based data model. In a session-based model, the data is grouped into sessions, or groups of user interactions with your website that take place within a given time, and these sessions are the foundation of all reporting.
Google Analytics 4 uses an event-based data model. An event-based data model captures all interactions on a website or app as events.
This makes comparing data from the two platforms tricky, as it’s being collected in two different ways. It's not impossible to compare the data, however, it won’t be comparing apples to apples. Some metrics will vary slightly between the two, while others will vary drastically.
To dig deeper into comparing data between Universal Analytics and Google Analytics 4, check out one of our GA4 Training 101 Sessions.
Tracking IDs
Universal Analytics used Tracking IDs to identify which account and property to send data to in Analytics. The Tracking ID could be found in Universal Analytics property settings and started with ‘UA-’ followed by a unique string of numbers.
Google Analytics 4 uses Measurement IDs to identify web data streams. Measurement IDs are used to send data to specific web data streams. The Measurement ID starts with ‘G-‘ and is also followed by a string of unique numbers.
Account Structure
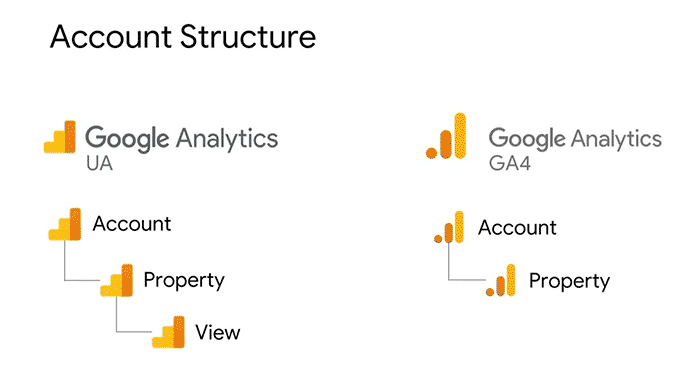
Account structure is the full hierarchy of your Google Analytics account. Here you can see a map view of how both properties are structured.

In Universal Analytics, the account structure was as follows:
- Account
- Property
- View
- Property
The account was the highest level in the hierarchy and it was where you logged in and organized your data if you had multiple properties. The property was where your company’s online data was collected by Google Analytics. If you collected data for multiple websites, you would have had multiple properties under your account. Lastly, the view level was where you could apply filters to define a set of data to measure. You could also have multiple views under each property.
For example, within one property, you might have the three recommended views: an unfiltered, a test view, and a master view. Having multiple views ensured you didn’t lose any data while testing filters or other settings that affected data collection.
Now in GA4, the account structure is:
- Account
- Property
Google Analytics 4 does not utilize “views.” However, multiple data streams can be set up to organize and sort through data easily. Three types of data streams include Web, iOS Apps, and Android Apps.
Conversions
Conversions represent the number of times a user triggered an event that is valuable to your business. This metric is an essential part of business performance reporting.
In Universal Analytics, Goals were created to track conversions. Universal Analytics calculated only one conversion per session for each goal. For instance, if a user submits a form twice during the same session, only one conversion will be counted for that goal.
In GA4, Goals are no longer. Instead, you can select which events should be marked as conversions. Conversions are now calculated for every instance of the conversion event. For example, if a user submits a form twice during the same session, then two conversions will be counted.
Reporting Interface
In Universal Analytics, the reporting interface was in the property view. The standard reports were grouped into 5 buckets: Realtime, Audience, Acquisition, Behavior, and Conversions. Each group had a drop-down with various related reports.
In Google Analytics 4, the reporting interface is in the property’s data stream. For the standard reports, you’ll see that they are now classified into two major buckets. The Life cycle collection and the User collection.
The Life cycle collection of reports helps you visualize and analyze data according to the four stages of the customer lifecycle. Under the Life cycle category, there are reports for Acquisition, Engagement, Monetization, and Retention.
The User collection of reports will provide insights into the makeup of users visiting your website. In this drop-down, there are reports for Demographics and Tech.
To learn more about navigating the reporting interface, check out our latest blog post on how to find UA reports in GA4.
GA4's New Metrics
Google Analytics 4 offers new metrics that were not offered in Universal Analytics. These new metrics include:
- Active Users – The Active User metric is the total number of engaged users on a website or app. To be considered active, the user needs to have the web page in focus or the app in the foreground for at least one second.
- Engaged Session – The Engaged session metric refers to how many visitors are engaged on the site. To be an engaged user, the user must remain on the site or app for more than ten seconds, view at least two or more pages, or trigger at least one conversion. This metric provides important information about the quality of the visits to the website or app.
- Average Engagement Time Per Session – The Average engagement time per session metric is calculated by dividing the total time by the total number of sessions. This metric offers important information about the user journey. It can also help you to evaluate the loading speed, current errors on the website or app, and interface user-friendliness.
- Engagement Rate – The Engagement rate metric identifies how users are interacting with the content on the website or app. This metric provides an understanding of the user experience and how it can be improved. Engagement rate is calculated by dividing the number of engaged sessions by the total number of sessions.
Removed & Changed Metrics
Although there are many new metrics offered in Google Analytics 4, some metrics are no longer available. The metric that isn’t available in Google Analytics 4 is:
- Pages/Session – The Pages/Session metric was one of the five goal types supported by Universal Analytics. The other goal types include Destination, Duration, Smart goals, and Event goals. In Google Analytics 4, Pages/Session is not available and is replaced by Views per session.
Segments
A segment is a subset of analytics data. Since segments work the same in both properties, they can be used in both Universal Analytics and Google Analytics 4.
In Universal Analytics, you can create two segment types: session segments and user segments. Segments are also applied to almost all reports in the interface.
Meanwhile, in Google Analytics 4, segments are only available in Explorations and can only be applied to a single report. Segment types in Google Analytics 4 include user segments, event segments, and session segments.
Event and Goals
In Universal Analytics, events were only measured if manual code was implemented into the site. Then, conversions could be measured by setting up goals and e-commerce transactions in the Admin settings.
However, in Google Analytics 4, conversions are measured with events that are flagged to be tracked as a conversion. Google Analytics 4 events are categorized in four different ways:
- Automatic events
- Enhanced events
- Recommended events
- Custom events
Automatic events are tracked and triggered through basic interactions with your website without needing to write any additional code to collect these events.
Enhanced events can also be and tracked, but this is a feature that must be enabled in the data stream. Simply toggle on ‘Enhanced measurement’ under Events in Web stream details.
Recommended events are events that Google strongly recommends you use but require additional context to begin tracking.
And lastly, Custom events allow you to set custom-defined parameters so you can collect information that's specific to your business.
Cross-Platform and Cross-Device Tracking
Google Analytics 4 offers more robust cross-platform and cross-device tracking that combines website and mobile app usage data into one property. The tracking results are more reliable because both use the same schema for conversion measurements. Google Analytics 4 also allows you to see separate results, as well as cross-device insights.
DebugView Report
The DebugView report is a new feature in Google Analytics 4 that shows data from events, event parameters, and user properties as it is collected. The DebugView Report assists in the setup of data collection, troubleshooting issues, and understanding a user’s behavior as the user explores the website or app. It works differently from the Realtime report, though, as it must be enabled by either implementing a debug extension or by using another Google tool, Google Tag Manager.
IP Anonymization
IP Anonymization, also known as IP masking, is the method of replacing the original IP address with one that cannot be associated with or traced back to an individual user.
Universal Analytics allowed the IP Anonymization feature to be enabled or disabled.
Google Analytics 4 automatically enables the IP Anonymization feature and does not allow it to be disabled, meaning it always remains GDPR compliant. In fact, no cookies are used to send data to servers. From an EU privacy perspective, this is considered the most impactful feature of Google Analytics 4.
Bounce Rate
In Universal Analytics, Bounce Rate was used to calculate the percentage of single-page sessions that had no page interaction.
In Google Analytics 4, Bounce rate refers to the percentage of sessions that were not engaged sessions. For instance, if a user visits the website or app and utilizes the homepage for less than ten seconds, then leaves without triggering any events or visiting other pages on the site, then that session will count as a bounce.
The Bounce rate metric in Google Analytics 4 is a more useful way of measuring customer engagement levels with a site or app. For example, in Universal Analytics, a bounced session included instances such as a user reading through all the content on a page for several minutes, not clicking on anything, then leaving the site. Although the user didn’t click on anything or go to another page, they still read through the copy and could eventually return and convert.
Which Version of Google Analytics Do I Have?
It is important to remember that Universal Analytics will be getting replaced by Google Analytics 4 on July 1, 2023. After this date, your web analytics data will not be collected unless this new property is set up properly and tested.
Identifying which version of Google Analytics you have is the first step in the Google Analytics 4 setup process. To identify which Google Analytics property you have, look at the reporting interface. The Universal Analytics reporting interface has Realtime, Audience, Acquisition, Behavior, and Conversions reports in the left-hand navigation panel. The Google Analytics 4 reporting interface has a sliding panel for its left-hand navigation which includes Home, Reports, Explore, Advertising, and Configure.
Enroll in Evolve Marketing’s Hands-On GA4 Training
Request a quote today for help setting up and configuring your new Google Analytics 4 property.
If you are in Akron, OH, or are in Northeast, Ohio, the team at Evolve Marketing offers in-person training for you and/or your team. Contact us today to learn more about our hands-on GA4 training sessions.


