Universal Analytics, also known as GA3 and UA, was introduced in the fall of 2012. This is the Google Analytics property we've all grown to know and love. It's how we collect data on our websites and review how users interact with them. But like all technology, Google Analytics has evolved.
In late 2020, Google announced its newest property: Google Analytics 4. Google Analytics 4, known as GA4, will be fully replacing Universal Analytics on July 1, 2023, and will become the only property type available in Google Analytics.
Since UA and GA4 will essentially provide the same data (but with new and improved features), these two properties share various similarities. In this blog post, we will review consistent metrics and reports between the two properties so you can transition from UA to GA4 with ease.
Universal Analytics Overview
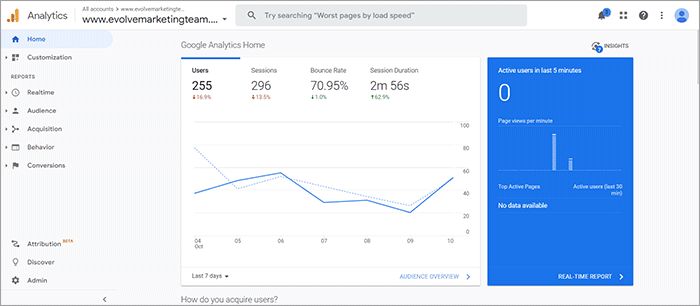
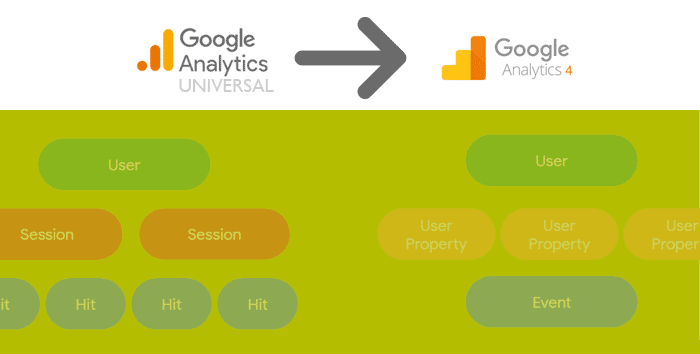
Before we compare UA and GA4, let’s review the basics. UA reporting uses a measurement model based on sessions and pageviews. It offers marketers the creation of various reporting options based on unique aspects of their business model and the behavior of users. The rollout of UA eliminated duplicate session reporting and allowed metrics to be imported from outside sources to gain more insight into customer behavior.

Google Analytics 4 Overview
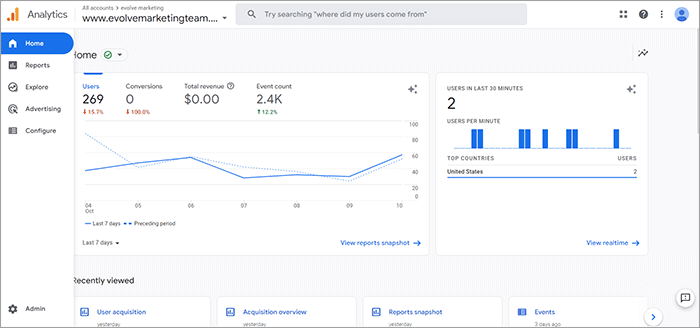
GA4 uses an event-based measurement model that allows marketers to better understand user journeys with enhanced tools and features. This new Google Analytics property allows marketers to edit, correct, and fine-tune how events are tracked in analytics without editing the on-site code after the initial tracking code implementation.
Since the replacement date is quickly approaching, it is crucial to set-up and understand how GA4 works to ensure no website data is lost or missed. Contact our digital marketing team if you need help setting up your GA4 property.

What metrics are consistent between GA4 and Universal Analytics?
Both GA4 and UA properties share consistent metrics. The metrics used in both analytics properties include:
- Users
- New Users
- Pageviews
- Purchases
- Sessions
Users
Although the term “Users” appears the same in both properties, the calculation for this metric is different. In UA, this metric appears as “Users” in reports and focuses on Total Users. GA4 also utilizes the term “Users” in reports but focuses on Active Users, users that trigger an action, or what GA4 calls events (E.G., page_view, file_download, click, first_visit). Total users can only be viewed via custom reports in GA4.
New Users
The terminology and calculation for New Users are consistent in both UA properties and GA4 properties. This metric refers to users who visit the site or app for the first time.
Pageviews
An instance of a page being loaded or reloaded in a browser is referred to as a Pageview. Pageviews are the same in both UA and GA4. However, this metric is referred to as “views” in GA4.
Purchases
The purchases metric, also known as unique purchases, is used in both properties to understand customer purchasing habits. In both Google Analytics properties, this metric is the total number of times a specified product or set of products is included in a transaction.
To collect e-commerce data in GA4, you need to add e-commerce events to your website or app or in your Google Tag Manager container. To collect e-commerce data in UA, you must enable the e-commerce settings for your property’s view.
Sessions
Sessions represent the period a single user is active on an app or website. Although there is no limit on session duration for GA4, after 30 minutes of user inactivity the session will be ended or timed out.
Where Can I Find Consistent Reports Between GA4 and Universal Analytics?
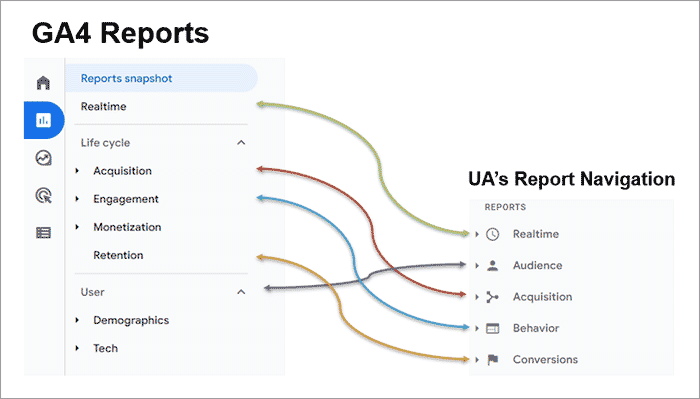
GA4 and UA also offer similar reporting. Below is a list of reports that are consistent within both properties but may appear in different locations.

Acquisition Overview
The Acquisition Overview report provides traffic information and data including where the traffic originated and how the user arrived at the website or app.
In UA, the Acquisition Overview report could be found by selecting Acquisition and choosing Overview in the left-side navigation.
In GA4, the Acquisition Overview report can be accessed by navigating to Reports and selecting Acquisition from the left-side navigation.
Source/Medium
The Source/Medium report in UA was one of the most popular reports. This report quickly observed the source and medium of users landing on the website. In other words, where the user was “coming from”.
- Source = The source of your traffic (Google, Facebook, specific website address, etc.)
- Medium = The general category of the source (organic search, paid search, web referral, etc.)
The Source/Medium report could be found in UA by going to the “Acquisition” tab in the left-side navigation, then clicking the “All-Traffic” dropdown and choosing “Source/Medium”.
To view this report in GA4, navigate to “Reports” and use the Acquisition drop-down to select “Traffic Acquisition.” In this report, scroll down to the table and in the first column is a drop-down menu. Use this to select "Session source/medium."
Pages & Screens
Monitoring the Pages & Screens performance is critical. The Pages & Screens report shows a breakdown of the performance of the website and mobile apps according to page and screen views. This report is different from the Landing Page report because it reports on every page of the website.
In UA, the Pages & Screens report can be found by navigating to “Behavior,” selecting “Site Content,” and choosing “All Pages.”
In GA4, this report can be found by first navigating to “Reports,” then selecting “Engagement,” and finally choosing “Pages & Screens.”
Landing Pages
The Landing Page report shows the performance of your web pages that users “land on” or, in other words, the first page they see when they enter your site.
In UA, the Landing Page report was found by opening the “Behavior” reports, selecting “Site Content”, and choosing “Landing Pages”. In GA4, the Landing Page report is not readily available but can be created.
In GA4, a landing page report must be created as a custom report. Check out our how-to-find basic data from UA in the GA4 blog post for step-by-step instructions on how to create this report.
Events
Although event data is collected differently in GA4 vs. UA, the Events reports are used in both properties to track interactions with content such as videos, downloadable items, button clicks, and more.
The purpose of the Events report in UA and GA4 is to discover how users engage with your site and to visualize the path that users took from one event to the next.
Once event tracking was set up in Universal Analytics, the Event report could be found by navigating to “Behavior,” selecting “Events,” and choosing to view the “Top Events.”
In GA4 a default grouping of events is automatically tracked. The Events report can be found by choosing “Reports,” clicking on “Engagement,” and selecting “Events.”
Conversions
The Conversion report shows a summary of the set goals and how often the goals are being completed.
A great feature of the Conversion report is being able to see where users of the goal completion came from by analyzing the Source/Medium. The Source/Medium feature is extremely helpful, as it shows which marketing efforts have been the most influential.
In UA, the Conversion report can be found by navigating to “Conversions,” selecting “Goals,” and choosing “Overview.”
In GA4, the Conversions report can be found by going to “Reports,” selecting “Engagement,” and choosing “Conversions.”
Demographics
Demographic data is important because it provides deeper insights into your website or app’s audience and can even be used to create audience personas. The Demographic and Interests data report in UA and GA4 provides information about the user’s age, gender, and interests.
The Demographics and Interests report in UA needed to be enabled from either the Admin or Reporting tab. Once enabled, this report could be found by navigating to “Reports” and then "Demographics".
In GA4, demographic data is automatically tracked. The Demographics Report can be found by navigating to “Reports,” selecting “User,” choosing “Demographics,” and “Demographics Overview.” Each card can then be investigated more closely by selecting the blue text in the bottom right-hand corner of the card.
Tech
The Tech report displays app and website traffic by the user’s technology, including platform, operating system, screen resolution, and app version. Understanding the technologies users are utilizing helps to fine-tune current versions and plan for future website redesigns.
The Tech report could be accessed in Universal Analytics by navigating to “Audience,” selecting “Technology,” and choosing “Browser & OS.”
The Tech report in Google Analytics 4 can be found by navigating to “Reports,” utilizing the “User” drop-down, and selecting “Tech Overview.”
Interested in some hands-on GA4 Training?
If you’re feeling overwhelmed about the new GA4 property, our team at Evolve Marketing is happy to assist you with any questions you may have. If you reside in Akron, OH or Northeast Ohio we’d love to train you and/or your team in person. Learn more about our GA4 training sessions by contacting us today or by checking out our other GA4 helpful blog posts.


