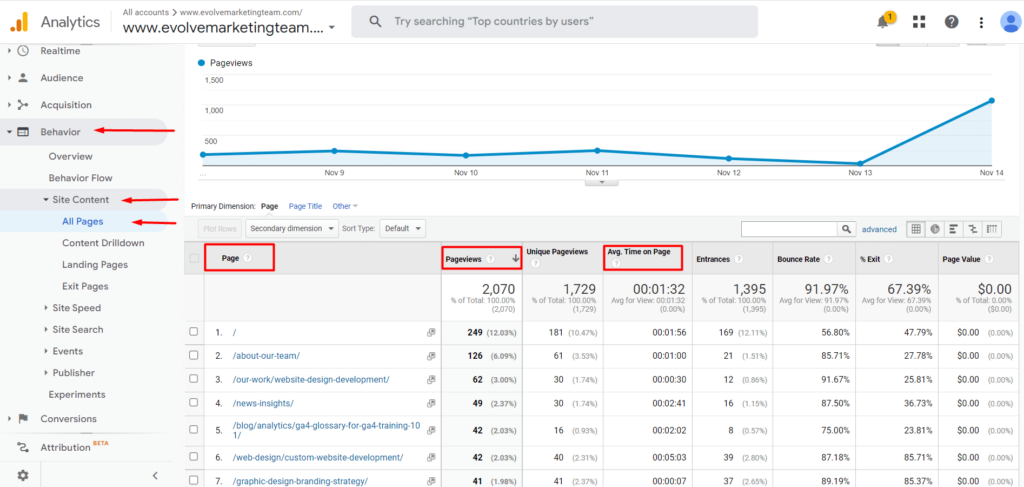
In Universal Analytics (UA), if you wanted to see which pages on your website were getting the most traffic, you could navigate to the All Pages report by clicking on Behavior in the left side menu, then Site Content, and All Pages. Once you’re viewing the All Pages report, you have the ability to sort by Pageviews, Average Time on Page, and more.

Even though Google Analytics 4 (GA4) doesn’t have a report with the same name, luckily, there is a way to see similar data so you can analyze your most popular web pages.
Pages and Screens Report GA4
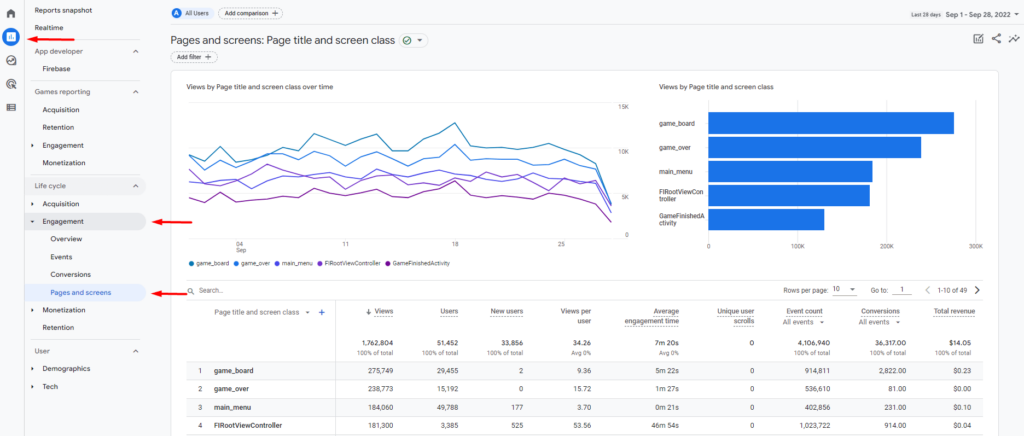
To see the most viewed pages on your website or the top pages, you’ll need to navigate to the Pages and screens report. To do this, click Reports in the left-hand menu, then Engagement, then Pages and screens.

In UA, the All Pages report listed the pages using their URLs.
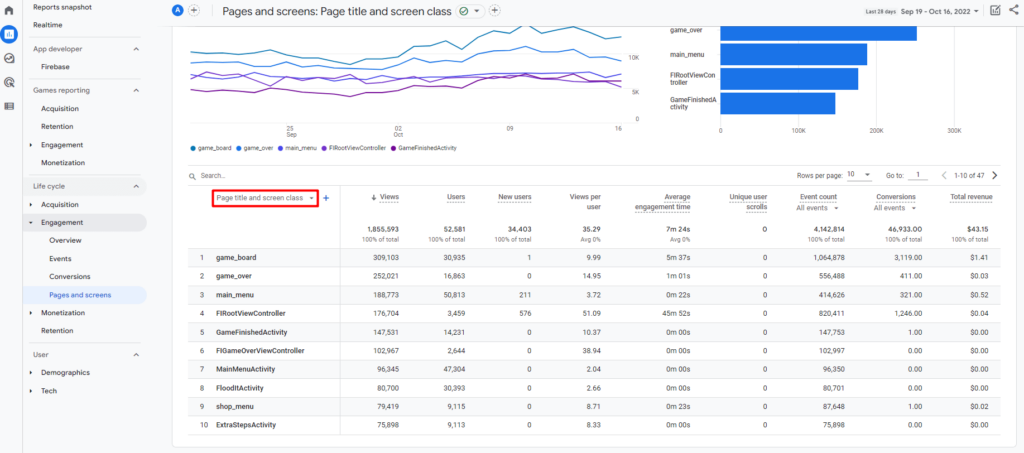
In GA4, you can see the pages listed in a variety of ways by selecting the drop-down under the search bar to toggle between Page title and screen class, Page path and screen class, Page title and screen name, or Content group. Select Page path and screen class to view the pages by their URLs.

The Pages and screens report also shows the following data:
- Views
- Users
- New users
- Views per user
- Average engagement time
- Unique user scrolls
- Event count
- Conversions
- Total revenue
Become a GA4 Pro with Evolve’s GA4 Step-by-Step Guides and Training
Want to learn how to find other basic data from Universal Analytics in GA4? Check out our other step-by-step guides in our blog: How to Find Basic Data from UA in GA4.
Our team at Evolve Marketing also offers live, in-depth GA4 training so you can navigate GA4 like a pro. Contact us today for more information.


