In Universal Analytics, the Assisted Conversions report showed the number of assisted conversions for each traffic channel. Assisted conversions are interaction points that lead to a conversion but are not the main source of the conversion point. To view this report, you could go to Conversions, then Multi-Channel Funnels, then click Assisted Conversions.
In addition to viewing the Assisted Conversions report, you might also view the Top Conversions Path report to see supporting data. This report showed you more details about the path taken by assisted conversion interactions before a user converted.
Follow this step-by-step guide to learn how to navigate to assisted conversion data in Google Analytics 4.
Using the Conversions Paths Report in Google Analytics 4
Before you can navigate to the Conversions paths report, you must first have e-commerce tracking and/or goal conversion tracking set up. Your Google Analytics 4 property needs to have conversion data before you can use the Conversion paths report.
Our team can help set up conversion configurations so that GA4 collects the data that is important to you and the success of your business. If your conversions are all set up, follow the steps below to navigate to the conversions path report.
In Google Analytics 4, the Assisted Conversions and Top Conversions Path reports from UA have been combined into one. To view the Conversions path report, click on Advertising in the left-hand navigation. Then click on Attribution and Conversion paths.
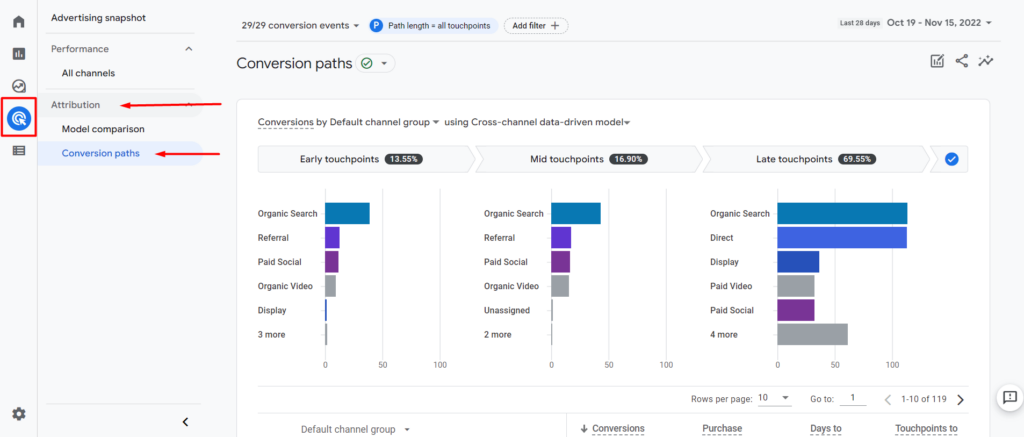
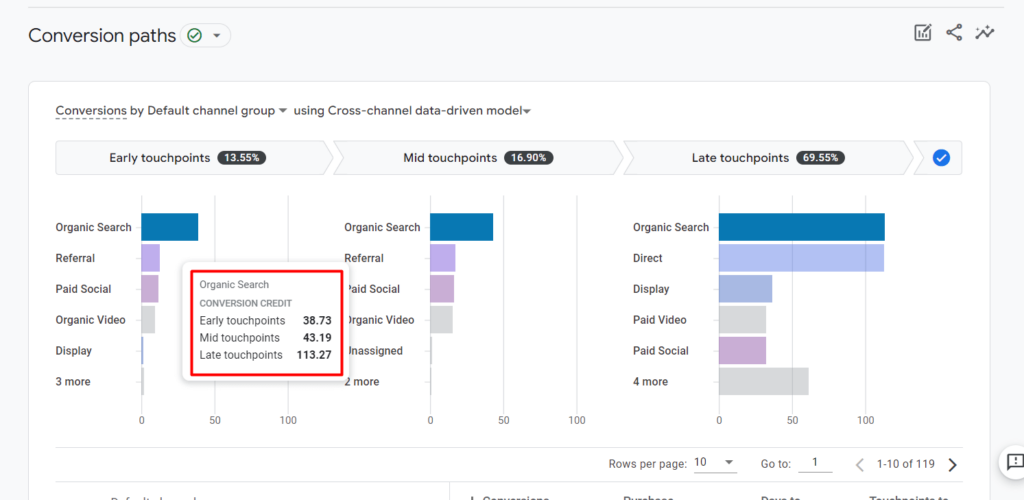
Here you will first see the data visualization section. This graph shows how much conversion credit each segment (touchpoint category) on the conversion path receives using the selected attribution model.
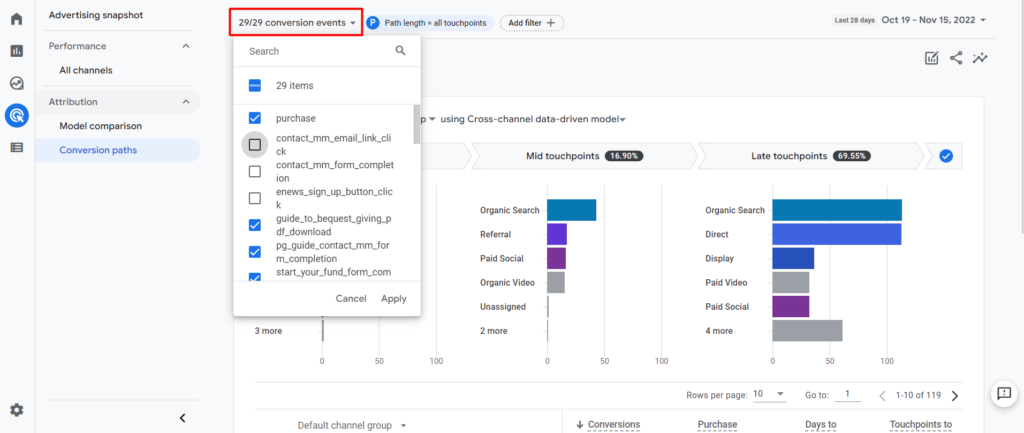
In the top left corner (to the right of the left-side navigation panel), you can use the drop-down to select which conversion data you want to view.
Once you have your conversions selected, you can change the selected dimension and the attribution model.
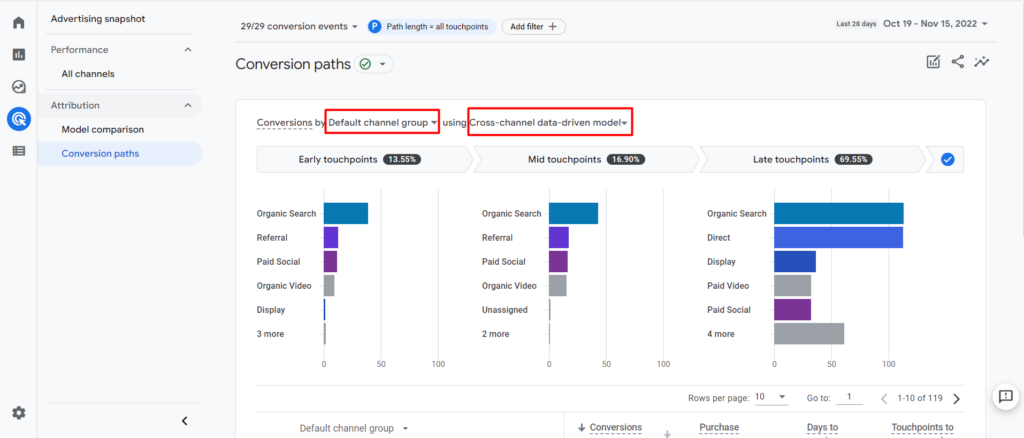
When you have selected your conversions, traffic dimension, and attribution model, the bar chart will show you how much conversion credit that particular dimension (channel, source, medium, campaign) receives while in that touchpoint phase of the conversion path. You can hover over a bar for more information.
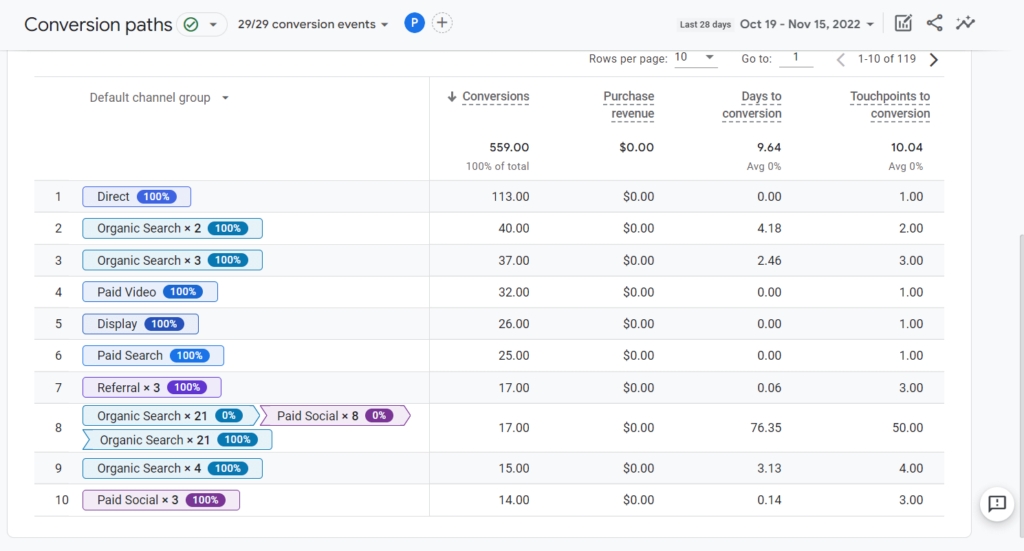
Below the data visualization graph, you will find the data table. The data table shows how the selected conversions are performing.
Looking for More GA4 Step-by-Step Guides and Training?
Check out our other step-by-step guides in our blog: How to Find Basic Data from UA in GA4.
If you’re looking for one-on-one, hands-on training, our team at Evolve Marketing also offers live, in-depth GA4 training sessions so you can navigate GA4 like a pro. Contact us today for more information.